Executive Summary
Every year, the US-China Business Council undertakes a comprehensive, econometric analysis of US goods and export data to China, broken down by states and voting districts. As in previous years, our data finds that China continues to be a critical export market for American manufacturers and service providers. However, rising uncertainty and bilateral tensions are negatively impacting the commercial opportunities China presents for American companies. Trade tensions with China hit US goods exports in 2018, down 7 percent from the previous year. Services exports increased, but at a slower pace than in previous years. Despite these challenges, trade with China continued to contribute to US economic growth, with US exports to China supporting more than 1.1 million American jobs.
- China is the third-largest market for US goods and services exports. Despite trade friction and punitive tariffs, China remained a top market for US goods exports in 2018, with only NAFTA partners Canada and Mexico buying more goods. It was also the third-largest market for US services exports, after the United Kingdom and Canada.
- Trade tensions continue to weigh on the economy. Punitive tariffs contribute to an unpredictable business environment and are measurably harming US exporters and exacerbating the trade deficit with China.
- Most congressional districts have seen significant increases in exports of goods and services to China in the past decade, though exports in the last year were down—in some cases, significantly. All but eight congressional districts saw triple-digit growth in service exports to China over the last decade of available data, but the picture is not so rosy for goods exports. Only 104 districts saw triple-digit growth in goods exports from 2009 to 2018.
US Exports and US Jobs
- Exports to China support over 1.1 million American jobs. Districts across the country have jobs that are supported thanks to US exports to China, making trade important to not only US companies and consumers, but also US workers. US goods exports to China come from a wide range of industries including transportation equipment, semiconductors, and oil and gas, sustaining logistics jobs in America’s ports and throughout the country. US services exports to China included travel and education, industrial processes, and management services, among other industries.
Goods Exports
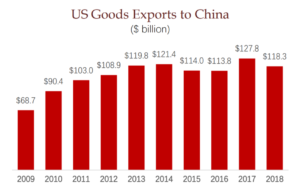
- US goods exports to China declined in 2018, after posting a record high the previous year. The United States exported $118.3 billion in goods to China in 2018, compared with an alltime high of $127.8 billion in 2017. The 7 percent, or $9 billion, decline is likely due to the trade conflict between the United States and China which resulted in retaliatory tariffs on an estimated 85 percent of US goods, including most agricultural products.
- Despite the decline, goods exports to China still outpaced export growth to the rest of the world over the last decade. US exports of goods to China increased 72 percent over the last decade, while exports to the rest of the world grew only 57 percent.

Services Exports
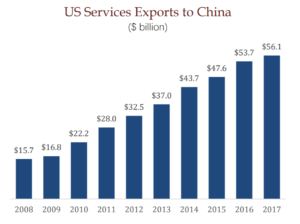
- Compared with previous years, US services exports to China grew more slowly in 2017, the latest year of full data, though they still outpaced services exports to other major markets. Services export growth to the rest of the world grew 2.7 percent faster than China that year. Over the last decade, however, US services exports to China grew significantly faster than those to the rest of the world–258 percent versus 49 percent.

Districts across the country feel the effects of the trade dispute
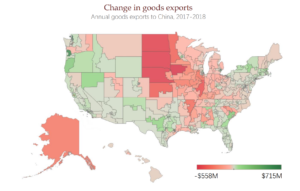
- Growth in exports to China slowed due to trade disputes between the United States and China. Two hundred and sixty-five congressional districts saw lower goods export volumes in 2018 than in 2017, and another 61 districts saw less than $10 million dollars in export growth in the same period. Midwestern and Plains districts that export significant quantities of soybeans and other agricultural products were hit particularly hard. In services, 100 districts exported less to China in 2017 than they did in 2016, and only 23 districts had double-digit growth in services exports. Compare that to 2015 to 2016, when only eight districts saw a decline in services exports and 380 saw double-digit or higher growth.
- Trade disputes also affected the overall value of exports to China. In 2017, 12 districts exported more than $1 billion in goods to China and 34 more exported over $500 million; in 2018, those numbers fell to 10 and 25, respectively. The export of services remained relatively stable from 2016 to 2017, with 192 districts exporting more than $100 million in both years. Continued growth in services may be the result of services exports not being subject to tariffs.
- China is a top goods and services export market for most districts. China was a top three goods export market for 240 districts in 2018, and among the top five for 357 districts. China was a top three services export market in 2015 for 305 congressional districts and a top five market for 396 districts.

To read original report, click here
