It is commonly observed that economies specializing in sectors, such as services, that face relatively high trade costs tend to run current account deficits, while those specializing in more easily tradable sectors tend to run surpluses. This column tests the causality of this observation by constructing a measure of effective trade costs. Results show that although higher effective exporting costs are associated with lower current account balances, the impact of those costs is quantitatively limited. The findings suggest that the contribution of trade costs to observed global imbalances has been modest.
A politically influential rationale for raising trade barriers has been their presumed impact on rebalancing the current account (CA). A well-cited observation in these debates is that some major economies that specialize in sectors facing relatively high trade costs, such as services, tend to run CA deficits, while countries specializing in sectors characterised by low trade costs tend to run CA surpluses.1 For example, Figure 1 illustrates the negative correlation between services trade and CA balances – where both are measured as a share of GDP – for the world’s five largest economies. Based on this observation, some have argued that global imbalances could shrink if trade costs became more closely aligned across sectors through either lower trade costs for services or higher costs for manufacturing.
Figure 1 Current account and services trade balances, 2001–2017
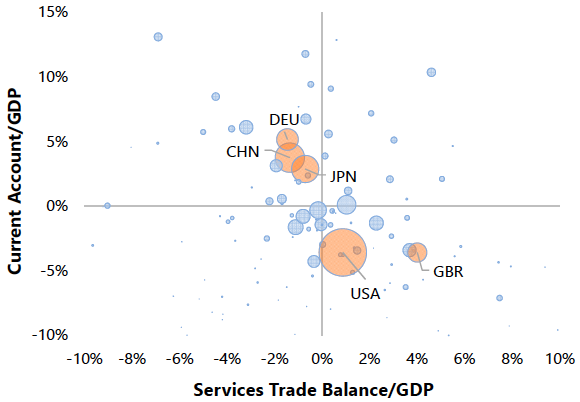
Source: IMF World Economic Outlook database.
Notes: Each bubble represents a country, where bubble sizes are proportional to countries’ average GDP (in US dollars) over the period 2001–2017.
In our recent work, we test the hypothesis that trade costs, especially as they apply to countries’ prime export sectors, can have an economically significant impact on CA outcomes (Boz et al. 2018). To do so, we study a globally representative sample of countries over nearly half a century, and empirically quantify the effects of trade costs on CA outcomes while accounting for specialization patterns.
Constructing effective export costs and import costs
We measure disaggregate trade costs by applying the Ricardian trade model of Eaton and Kortum (2002) to data on bilateral trade flows in agriculture, manufacturing, and services. Deriving separate estimates for different years and sectors, we allow the trade costs and their relationship with trade flows to vary over time and across sectors. Importantly, our measures of trade cost include nontariff barriers that are difficult to quantify but potentially pervasive, especially in the services sector. Another important feature of our bilateral trade cost estimates is that they are asymmetric between importers and exporters because we allow them to have an importer-specific component, which is intended to capture importing barriers that apply to all trading partners in a non-discriminatory fashion. Barriers such as regulatory, licensing or reporting requirements, the quality of institutions, and the rule of law are prime examples of such non-discriminatory obstacles to trade.
Comparative advantage is difficult to measure because it requires characterising the differences between world prices and domestic prices that would have prevailed under autarky. Since the counterfactual relative prices cannot be observed, we follow Hanson et al. (2018) and use the gravity equation to infer each country’s sectoral export capability before applying a ‘double normalisation’ to obtain the comparative advantage. In this procedure, the first normalisation is relative to the world average of export capability and yields the absolute advantage for each country-sector pair. Second, we normalise absolute advantage relative to its countrywide average across sectors to remove the potentially confounding effects of domestic aggregate growth. The resulting measure of comparative advantage reflects differences in countries’ technology adjusted for input costs and is more refined than the traditional ‘revealed’ comparative advantage of Balassa (1965), which is calculated using only observed gross trade flows.
Armed with these estimates, we compute effective trade costs to capture the size of overall costs to countries’ natural exports and natural imports. To do so, first, we take the disaggregated bilateral trade costs at the sector level and aggregate across trading partners (using either lagged trade weights or free-trade weights), generating two separate measures at the country-sector level – costs to import and costs to export. Next, we aggregate across sectors using sectoral comparative advantage as weights and arrive at effective trade costs at the country level.
Effects of trade costs on current account balances
Introducing the estimates of aggregate effective trade costs – separately for both the export and import sides – to an empirical model of CA determination developed by the IMF for the assessment of countries’ external balances, we find that countries facing higher export costs in their comparative advantage sectors have modestly lower CA balances.2 For the sample period of 1986 to 2009, a 10 percentage point unilateral reduction in aggregate effective export costs for an average country is associated with a CA balance improvement amounting to 0.5–0.8% of GDP (depending on the aggregation scheme). Estimates based on a 2001–2014 sample yield effects that are about half the size of those for the earlier period. Effective costs of importing generally have small and statistically insignificant effects. These average effects mask substantial heterogeneity across countries. For example, a non-negligible portion of the current account deficit in the US can be attributed to higher-than-average effective costs to export.
Consistent with the above estimates, Figure 2 suggests that the contribution of effective trade costs to global imbalances has been minor. After sorting countries into CA surplus and deficit groups, the actual and predicted values of the aggregate CA balance of each group are calculated as a share of their total GDP. The predicted values are then decomposed into those predicted by the trade cost measures, both when exporting and importing, and by other factors included in the CA model (including fiscal policy, changes in foreign exchange reserves, capital account openness, expected medium-term economic growth, per capita income level, domestic credit, and demographics). Looked at in this way, the contribution of trade costs to global imbalances has been a small fraction of the actual imbalances throughout the sample.
Figure 2 Contribution of effective trade costs to global imbalances
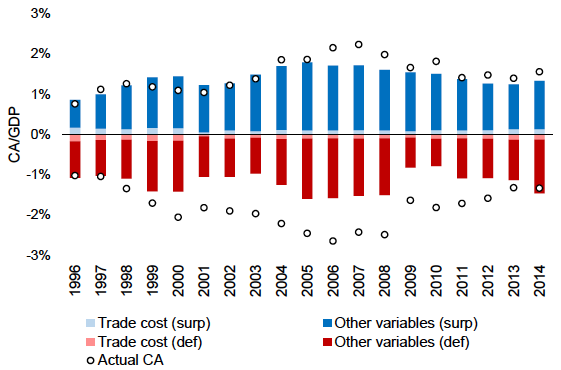
Sources: For years through 2000, Johnson and Noguera (2017); for years thereafter, the World Input Output Database (WIOD) constructed by Timmer et al. (2015).
Notes: This figure plots the actual values (open circles) and predicted values (bars) of the CA separately for surplus (blue) and deficit (red) countries. The predicted values consist of those derived from effective trade costs (light shading) and from other variables in the IMF’s latest current account model developed for External Balance Assessment (dark shading), documented in IMF (2018). Effective trade costs are calculated using lagged trade shares.
While our analysis remains agnostic regarding the underlying mechanisms at work, the literature abounds with theories that generate small effects of trade costs on current account balances. A number of studies have introduced mechanisms that link trade costs to the CA, where these effects depend on the extent to which the shocks tilt the expected future profile of intertemporal prices and income, which are central macroeconomic determinants of saving and investment. For example, in a seminal contribution, Obstfeld and Rogoff (2000) show that trade costs can lead to a wedge between the effective interest rates faced by the borrowers and creditors, and thus may have a bearing on consumption and saving decisions. The CA effects of trade costs in that model, however, are unlikely to be significant, except at high levels of trade restriction. In more recent work, Barattieri et al. (2018), using data on antidumping investigations, find that protectionist policies can generate at best a small improvement in the trade balance, and highlight the contractionary effects of tariffs through inflationary pressure and misallocation of investment towards less efficient producers in a small open economy model.
References
Barattieri, A, M Cacciatore and F Ghironi (2018), “Protectionism and the business cycle,” NBER, Working paper 24353.
Boz, E, N Li and H Zhang (2018), “Effective trade costs and the current account: An empirical analysis,” IMF, Working paper no 19/8.
Chinn, M D and E S Prasad (2003), “Medium-term determinants of current accounts in Industrial and developing countries: An empirical exploration,” Journal of International Economics 59(1): 47–76.
Carney, M (2017) “A fine balance,” Speech at Mansion House, London, 20 June.
International Monetary Fund [IMF] (2018), “External sector report, refinements to the external balance assessment methodology–Technical supplement.”
Eaton, J and S Kortum (2002), “Technology, geography and trade,” Econometrica 70: 1741–79.
Hanson, G, N Lind and M-A Muendler (2018), “The dynamics of comparative advantage,” NBER, Working paper 21753.
Johnson, R and G Noguera (2017), “A portrait of trade in value-added over four decades,” Review of Economics and Statistics 99: 896–911.
Lee, J, G Milesi-Ferretti, J D Ostry, A Prati and L A Ricci (2008), “Exchange rate assessments: CGER methodologies,” IMF, Occasional Paper no 261.
Obstfeld, M and K Rogoff (2000), “The six major puzzles in international macroeconomics: Is there a common cause?,” NBER Macroeconomics Annual 15: 339–90.
Phillips, S T, L Catao, L A Ricci, R Bems, M Das, J Di Giovanni, F D Unsal, M Castillo, J Lee, J Rodriguez and M Vargas (2013), “The external balance assessment (EBA) methodology,” IMF, Working paper no 13/272.
Timmer, M P, E Dietzenbacher, B Los, R Stehrer and G J de Vries (2015), “An illustrated user guide to the world input-output database: The case of global automotive production,” Review of International Economics 23(3): 575–605.
Endnotes
[1] According to Governor Carney (2017) of the Bank of England, “One cause of global imbalances is the uneven playing field between trade in goods and services, with barriers to services trade currently up to three times higher. Most of the world’s major surplus economies, like Germany and China, are net exporters of goods and benefit from this asymmetry. Conversely, countries with comparative advantage in services, like [the] US and [the] UK, are more likely to run current account deficits.”
[2] The CA model is laid out in IMF (2018) which builds on earlier work by Phillips et al. (2013), Chinn and Prasad (2003), Lee et al. (2008), among others.
[To read the original paper, click here.]
Copyright © 2019 VoxEU. All rights reserved.