Global supply chains have become a “driving force” for globalization.[1] In this article, we concentrate on value-added supply chains, which track the cross-border transactions that dominate global trade and production. During the period 2000-2017, on a value-added basis, global supply chains have accounted for over 60 percent of total world trade, reaching 65 percent in 2008 and 64 percent in 2017 (see table below). Currently, those value-added supply chains face threats from increasing protectionism and the coronavirus pandemic. The IMF projects that the global economy will contract by three percent in 2020, a decline that is “much worse than during the 2008-09 financial crisis.”[2] The gains in productivity and technology that have accompanied the specialization and niche manufacturing of global value chains (GVCs) could be lost as world economic activity abruptly declines.
To establish a baseline for the assessment of the impact of the threats posed by the pandemic and increased protectionism, in this note we examine global supply chains in light of advances in research on global production networks. To do so, we utilize trade statistics from 2017, the benchmark from which to measure the future recovery or decline of globalization. The world trading system prior to 2018 was by no means free of barriers and ad hoc or “special” protective measures. However, 2017 was the last year before the Trump Administration’s trade war with China and imposition of other trade barriers began to impact global trade. In 2019, “persistent trade tensions” caused global merchandise trade to decline in the last two quarters of the year.[3]
The Pandemic and World Trade [5]
The pandemic has a two-fold impact on world trade: a sharp downturn global economic activity and the imposition of new trade barriers. Pressure is building for reshoring production of critical medical supplies, and new restrictions on exports of these supplies have risen in ways reminiscent of the “beggar thy neighbor” policies of the Great Depression. Already, many countries have raised barriers to the export of medical supplies. As of April 23, 2020, 76 governments had imposed 118 curbs on exports of COVID-19 related medical supplies and medicines.[4] Some nations have taken steps to counter the first knee-jerk protective reactions to the pandemic: as of April 17, seven countries had signed on to a joint declaration by New Zealand and Singapore aimed at preserving supply chains.[5] Other nations have begun to consider collective measures to ensure the free flow of needed supplies. Nevertheless, the initial responses to the pandemic have caused severe disruption of global supply chains. For example, Mexico’s “shuttering of factories” risks the destruction of North American supply chains that took years to build, a development that has led to complaints by US manufacturers to the Mexican government.[6]
Gaining an understanding of the disruption of global supply chains will require appropriate trade and production statistics. Multi-source production is now a fundamental characteristic of globalization.
In an era marked by increasing use of cross-border sourcing of components for manufactured products, it has become difficult to paint an accurate picture of international trade and production using traditional trade data, which obscure the role of GVCs. A great deal of international production occurs within GVCs, which highlight the value-added at each stage of production networks that involve suppliers in multiple countries. Measurement of trade on a value-added basis therefore captures the contribution of each nation’s producers to the process that brings a product from its conception to its end use[7].
Our analysis summarizes trends in value-added trade from 2000 through 2017. Following Degain, Meng, and Wang (2017)[8], we utilize the University of International Business and Economics (UIBE) GVC Indicators database, which decomposes GVC production activities using various inter-country input-output (ICIO) tables.[9] We utilize the UIBE GVC Indicators derived from the Asian Development Bank MRIO database. This is the only source that includes data through 2017, which other analyses have used, notably the GVC network analysis performed by Meng et al. (2018)[10].
The Asian Development Bank MRIO database offers global coverage of 62 nations from 2000-2017, across 35 industries. Using the UIBE GVC Indicators derived from this data, we summarize production activities involved in GVC-related trade and traditional trade. On a bilateral level, aggregating these measurements expresses the value-added of one nation that is absorbed by a second nation through GVC or traditional trade networks. Our analysis summarizes all bilateral linkages to measure the total level of participation in GVCs or traditional trade networks for a given nation or group of nations.
Accounting for trade using value-added measures provides a more accurate picture of world trade than traditional statistics, which show the gross value of final goods. For example, many products that Mexico exports to the United States are manufactured using intermediate inputs originally manufactured in the United States, Canada, or third countries. Thus, measuring trade on a gross export basis can overstate the value of imports from Mexico. Measuring trade on a value-added basis provides a clearer picture: in 2015, the OECD estimated that on a value-added basis the U.S. deficit with Mexico was $40 billion, 49% less than the $79 billion reported on a gross value basis[11].
Global Value Chains
A recent study examined world production activities and categorized GVC measurements into two distinct categories, simple and complex.[12] Simple GVCs include value-added that crosses a border only once during a good’s production and final consumption. Complex GVCs include value-added that crosses a border two or more times during the production and consumption of a good (including re-imports). Together, simple and complex GVCs encompass all cross-country production sharing activities. GVCs differ from “traditional trade,” which includes only the value-added by the exporting country and thus does not cross a border during production.
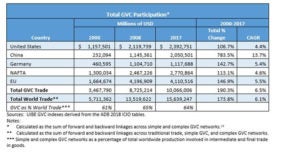
As the following table illustrates, total value-added trade within GVC networks grew from $3.5 trillion in 2000 to $10.1 trillion in 2017, a growth rate of 6.5%. Over the same period, total world trade increased from $5.7 trillion to $15.6 trillion, a growth rate of 6.1%. In 2017, the nations with the highest total GVC participation in absolute terms were the United States ($2.39 trillion), China ($2.05 trillion), and Germany ($1.12 trillion).
NAFTA countries (factory North America) contributed almost $2.8 trillion to GVC trade in 2017, counting trade within the free trade area and trade with other nations. The European Union (EU) made the largest contribution in 2017, registering $4.1 trillion in total GVC trade.
Regional Value Chains
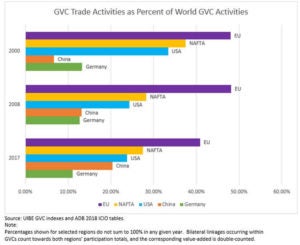
Despite the importance of North America in global trade flows over the period 2000 – 2017, the table shows that the United States and NAFTA did not keep pace with growth of GVCs worldwide. China increased its share of total GVC trade during the period 2000-2017. From 2008 onward, the GVC trade of the EU, NAFTA and the United States declined as a percentage of world GVC trade. Within the EU, Germany has remained a major hub for GVCs, but the growth of Chinese GVC trade has seemingly displaced some of Germany’s GVCs. However, the location of numerous German companies in China may account for some of that change.
Reshoring or Resilience
The global response to the current pandemic has exposed the downside to reliance on GVCs. Sectors of production that depend on complex GVCs are very susceptible to downturns in economic growth.[14] The WTO recently concluded that “trade is likely to fall more steeply in sectors characterized by complex value chain linkages, particularly in electronics and automotive products.”[15] Thus, as the pandemic breaks key links in complex supply chains, it is likely that such supply chains will experience interruptions of production.
The reassessment of global supply chains caused by the pandemic has led to a debate between advocates of reshoring and “buy local” requirements, and those that wish to maintain a global approach to ensure that nations continue to rely on efficient production of consumer goods, pharmaceuticals, and other manufactured products.[16] The advocates of reshoring call for national production instead of imports, or for supply chains that rely heavily on neighboring countries. Such retrenchments would entail a significant reshaping of the value-added supply chains that account for over 60 percent of global merchandise trade. A change of that magnitude would lead to inefficiencies, higher costs, and trade disputes. Fully aware of those dangers, EU Trade Commissioner Phil Hogan, while recognizing the need for some “strategic autonomy,” sees “self-sufficiency” as an “unobtainable goal.”[17]
National responses to the pandemic have already disrupted GVCs. In the medium- to long-term, corporate reactions to the crisis will shorten some supply chains and increase reliance on regional supply networks. Some reshoring is bound to occur. However, the creation of redundancy and resilience by using a variety of overseas and domestic suppliers is the constructive alternative to excessive reshoring, and one that would safeguard the efficiency of international GVCs.
Guy Erb is a former US trade policy official and investment banker, with experience in financial and trade advisory services and international organizations.
Scott Sommers is a Consultant with Berkeley Research Group and an incoming PhD student in Economics at the University of Minnesota.
The views and opinions expressed in this article are those of the authors and do not necessarily reflect the opinions, position, or policy of Berkeley Research Group, LLC or its other employees and affiliates.
***
© Washington International Trade Association
[1] Zhi Wang et al, “Measures of Participation in Global Value Chains and Global Business Cycles,” National Bureau of Economic Research Working Paper 23222, March 2017, p. 31,
[2] IMF, World Economic Outlook, April 2020. https://www.imf.org/en/Publications/WEO/Issues/2020/04/14/weo-april-2020. Accessed April 26, 2020.
[3] “Trade set to plunge as Covid-19 pandemic upends global economy,” WTO Press Release 855, April 8, 2020.
[4] Media reports assembled by the Global Trade Alert team, led by Simon J. Evenett, Professor and Co-Director, CEPR Programme, International Trade and Regional Economics, University of St. Gallen, Switzerland. See also, “Tackling Covid-19 Together: The Trade Policy Dimension,” Global Trade Alert, https://www.globaltradealert.org/reports/51, Accessed April 2, 2020.
[5] JOINT MINISTERIAL STATEMENT BY SINGAPORE AND NEW ZEALAND AFFIRMING COMMITMENT TO ENSURING SUPPLY CHAIN CONNECTIVITY AMIDST THE COVID-19 SITUATION, https://www.beehive.govt.nz/release/joint-ministerial-statement-singapore-and-new-zealand-covid-19-situation, Accessed April 2, 2019.
[6] “Mexico’s Economy get hit in sectors where it hurts most,” The Washington Post, Saturday, April 25, 2020, and “Mexico’s COVID-19 Response Threatening North American Supply Chains,” Politico’s, “Morning Trade”, April 24, 2020.
[7] Global Value Chains Initiative, Duke University, https://globalvaluechains.org/concept-tools. Accessed April 3, 2020.
[8] Degain, C., Meng, B., Wang, Z. (2017) Recent Trends in Global Trade and Global Value Chains. Chap. 2 in World Bank et al., Measuring and Analyzing the Impact of GVCs on Economic Development, World Bank, 2017.
[9] UIBE creates sets of GVC indicators sourced from the World Input-Output database, OECD-ICIO database, Eora database, and Asian Development Bank multi-region input-output (MRIO) database. Our analysis utilizes the GVC indicators created using the Asian Development Bank database. The Asian Development Bank database offers coverage of 62 nations across 35 industries.
[10] Meng, B., Xiao, H., Ye, J., Li, S. (2018) Are global value chains truly global? A new perspective based on the measure of trade in value-added. IDE Discussion Paper, 736, IDE-JETRO, Chiba City, Japan.
[11] OECD-WTO: Statistics on Trade in Value Added; https://www.stlouisfed.org/on-the-economy/2019/april/value-added-trade-measure. Accessed March 15, 2020.
[12] Wang, Z., Wei, S., Yu, X., Zhu, K. (2017) Measures of Participation in Global Value Chains and Global Business Cycles. NBER Working Paper 23222, National Bureau of Economic Research, Inc.
[13] Forward linkages comprise the value of exported domestic factor content. Backward linkages comprise imported value-added. Both forward and backward linkages are included in Total GVC participation.
[14] Wang et al., pp. 3 and 31.
[15] “Trade set to plunge as Covid-19 pandemic upends global economy,” WTO Press Release 855, April 8, 2020.
[16] Shannon K. O’Neil, “How to Pandemic Proof Globalization”, Council on Foreign Relations, April 1, 2020. https://www.foreignaffairs.com/articles/2020-04-01/how-pandemic-proof-globalization, Accessed April 1, 2020.
[17] Politico’s “Morning Trade,” April 17, 2020.