[Courtesy of European Central Bank]
Published as part of the ECB Economic Bulletin, Issue 4/2018.
The relevance of foreign direct investment (FDI) as a source of economic activity has increased rapidly over the last decade. Between 2000 and 2016 the share of FDI stock in global GDP increased from 22% to 35%. Following a decline during the Great Recession, mergers and acquisitions (M&As), the most dynamic component of FDI, have recovered, reaching a record value of USD 1.2 trillion in the first quarter of 2018. The intensification of FDI activity has important implications for both origin and destination countries in terms of, for example, economic growth, productivity, wages and employment. Moreover, the expansion of multinational enterprises (MNEs) has been accompanied by the creation of complex cross-border production chains, which also has important implications.
This article presents several findings regarding the main developments in and determinants of FDI over the past decade, at both global and EU level. Since the beginning of the 2000s there has been a gradual shift in the global FDI landscape, with emerging market economies (EMEs) gaining in prominence both as a source of and as a destination for such investment. EMEs have attracted a growing share of FDI flows, reaching more than 50% of the world’s total inward FDI in 2013. In addition, FDI flows are dominated by a relatively small number of M&As. In 2016 M&As with a value in excess of USD 1 billion accounted for only 1% of all FDI projects, but they generated 55% of total FDI flows. Moreover, evidence suggests that FDI and exports are not competing but complementary strategies for serving foreign markets. Finally, since 2008 EU countries are no longer the world’s main FDI investors and recipients. Nevertheless, econometric analysis shows that belonging to the EU dramatically boosts FDI flows in member countries.
1 Introduction
The last decade has witnessed a surge in FDI. Between 2000 and 2016, FDI stocks grew from 22% of world GDP to 35%. FDI, which is defined as a situation where a firm owns at least 10% of a company located in a different country,[1] is carried out by MNEs, which invest abroad either through greenfield investments (GIs), i.e. the setting-up of subsidiaries abroad, or through M&As.[2]
FDI has the potential to bring several benefits to the recipient country. The arrival of MNEs in a country can foster efficiency through increased competition. It can also produce positive productivity spillovers as MNEs integrate domestic firms into their production processes through forward and backward linkages. In addition, MNEs tend to make new technology available and provide access to new markets, improving the training and qualifications of the local workforce and increasing wages and employment. The extent of these positive outcomes will depend partly on the host country’s absorptive capacity.[3] For EU countries, existing evidence confirms the positive impact of FDI.[4]
Traditionally, advanced economies have played a major role as both the source and destination of FDI. Until the beginning of the Great Recession, almost 90% of outward FDI (OFDI) flows came from advanced economies. EU countries were particularly prominent, as their share in world OFDI was nearly 50%. At the same time, the EU and other advanced economies attracted between 60% and 70% of total inward FDI (IFDI) flows.
Since 2008 there has been a dramatic change in the global FDI landscape. OFDI and IFDI from and into EMEs have started to gain in importance. By 2014 EMEs represented 41% and 56% of global OFDI and IFDI respectively, while the EU’s share of OFDI and IFDI had shrunk to only 15% and 18% respectively.
This article provides an overview of the main FDI trends and drivers. Section 2 outlines some fundamental developments. Section 3 focuses on determinants of FDI. Section 4 addresses the relationship between FDI and exports, i.e. whether they are complementary or substitutes. Finally, Section 5 analyses the FDI performance of euro area and non-euro area EU countries over time, including the benefits of EU/euro area membership when it comes to attracting IFDI.
2 Key developments in global FDI
Over the last two decades the global map of inward and outward FDI has changed significantly. FDI has traditionally originated from advanced economies, which were also the main destination (see Chart 1). Since the early 2000s, the importance of EMEs as a destination for FDI has gradually increased. In 2013, for the first time, EMEs attracted more than 50% of global IFDI.[5]
Chart 1
Inward foreign direct investment by destination
(left-hand scale: share of advanced and emerging market economies in world IFDI, percentages; right-hand scale: total IFDI, USD billions)

Source: UNCTAD.
Over the last 16 years, EMEs have also progressively increased in importance as a source of FDI. As illustrated in Chart 2, the share of FDI originating from EMEs started to increase at the beginning of the 2000s. After 2008 the rate of growth of FDI from EMEs accelerated, and in 2014 EMEs accounted for 41% of total OFDI[6].
Chart 2
Outward foreign direct investment by origin
(left-hand scale: share of advanced and developing economies in world OFDI, percentages; right-hand scale: total OFDI, USD billions)
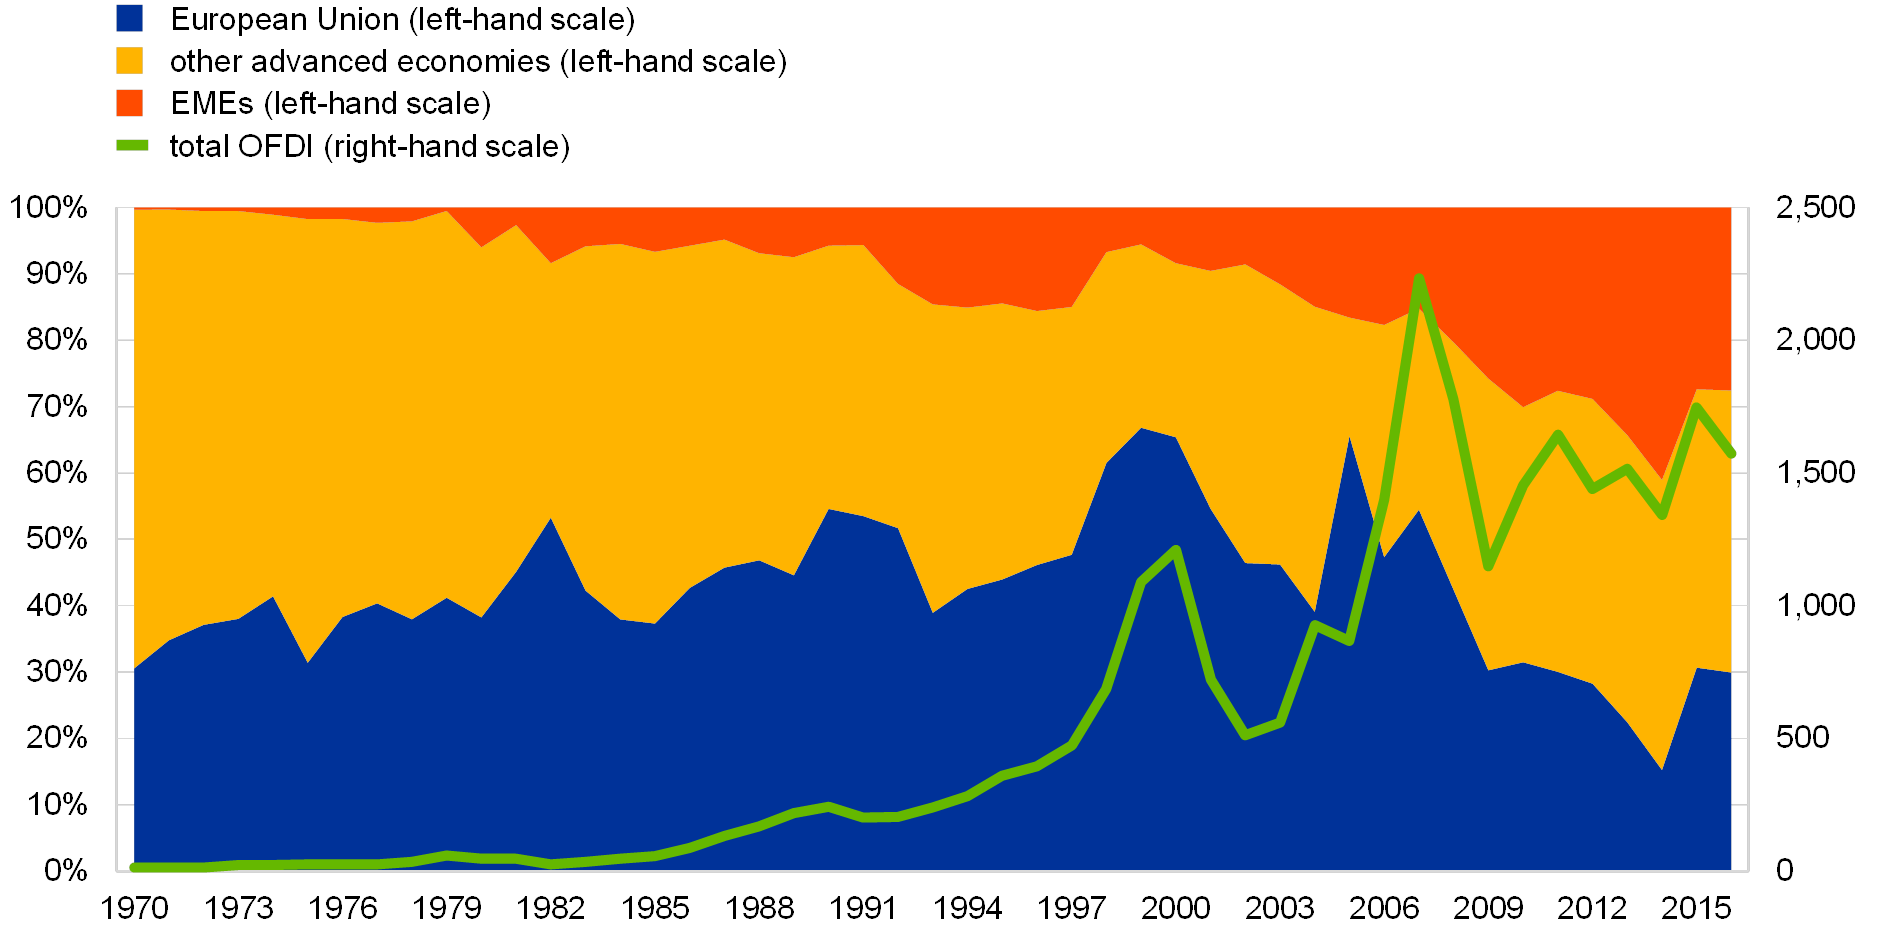
Source: UNCTAD.
In the EU and other advanced economies, M&As play a prominent role in total IFDI flows. Between 2003 and 2016, an increasing share of IFDI in the EU and other advanced economies was accounted for by M&As.[7] As shown in Chart 3, in both country groups M&As made up around 80% of total IFDI flows in 2016. Although M&As have also increased in importance in EMEs, IFDI in those countries is still dominated by GIs. In 2016 GIs accounted for around 80% of IFDI into EMEs. In the case of OFDI, a similar trend is observed. For the EU and other advanced economies, M&As had become the preferred mode of outward investment by 2016, while for EMEs GIs remained predominant. At the global level, in the period 2003‑2016 EMEs provided the destination for 62.7% of total GI and 19.3% of M&A investment. In terms of OFDI, the EU and other advanced economies accounted for 72% of GI and 82.4% of M&A investment.
Chart 3
Share of M&As in global IFDI and OFDI, 2003‑16
(percentages; share of M&As in total IFDI and OFDI volumes)
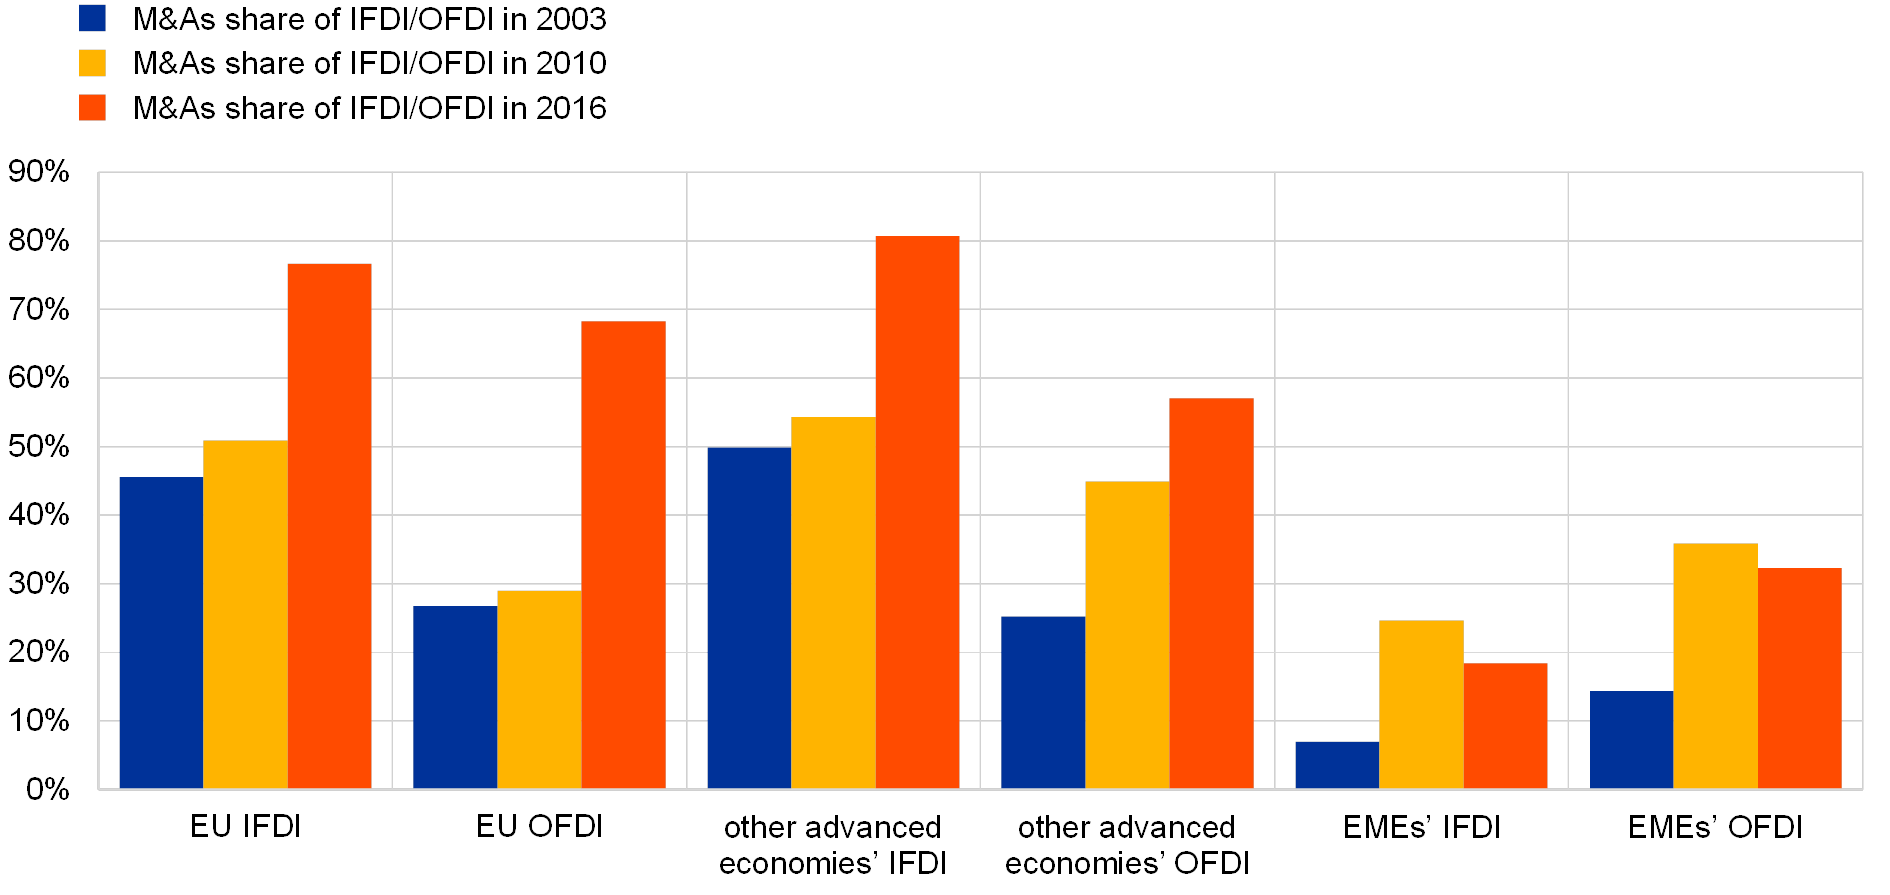
Sources: UNCTAD, Thomson Reuters and ECB calculations.Notes: Inward and outward GI data are taken from UNCTAD. Inward and outward M&A data are taken from Thomson Reuters. Calculations are based on a sample of 94 countries. Total IFDI and OFDI volumes for each year (2003, 2010 and 2016) are calculated as the sums of inward and outward GI and M&A flows respectively.
The services sector has become the main target for foreign acquisitions. The sectoral distribution of IFDI was fairly constant in the period 2003‑16. During this period, 70% of international M&As were in the services sector, followed by manufacturing (24%) and the primary sector (6%). In the case of GIs, the distribution between services and manufacturing was more even (50.4% and 48.2% respectively), while the primary sector lagged far behind (1.4%).[8]
3 The structural determinants of FDI
MNEs can engage in FDI activities for a number of strategic reasons (using local platforms to enhance market penetration, absorbing or transferring new technologies, gaining access to resources or control of competitors, reducing production costs, etc.). A firm’s internationalisation usually depends on three basic preconditions: (i) high productivity, as only the most productive firms have the capacity to invest abroad; (ii) the existence of firm-specific advantages which are not easily transferable to third parties and are at the core of the firm’s output; and (iii) a relatively strong market position in the home country.[9] The determinants of FDI can in turn be grouped in the following way: (i) ownership, which allows a firm to best exploit its competitive advantages abroad; (ii) location, which involves exploiting locational advantages across the globe (e.g. supply of labour or natural resources); and (iii) internalisation, whereby a firm internalises foreign markets for the use or generation of assets. Accordingly, FDI is driven by four main factors: (i) markets; (ii) assets; (iii) natural resources; and (iv) efficiency seeking.[10]
First, by investing abroad, companies may seek access to promising new markets. From this perspective, inward FDI should tend to be positively correlated with the size of the host country economy and its market potential in terms of economic growth.[11]
Second, asset-seeking FDI is driven by access to new, complementary resources and capabilities. This type of investment is motivated by a firm’s desire to improve or expand its existing technologies, managerial skills or labour force. It is often directed towards advanced countries.[12] In the EU, technological progress has been among the main drivers of IFDI.[13] Conversely, in the case of EMEs, a positive correlation between technological intensity and IFDI is not expected.
Third, FDI flows may also be driven by the desire for access to natural resources. This type of FDI is more likely to be directed towards EMEs which have abundant natural resources. However, large natural resource endowments can also deter IFDI into EMEs owing to what is known as the “natural resource curse”, i.e. the negative long-term impact of large natural resources on a country’s development (e.g. in terms of economic growth, institutional quality or capital allocation), which may hamper its capacity to attract FDI.[14] This outcome, however, is neither universal nor unavoidable, but affects certain countries under certain conditions, such as high dependence of exports and fiscal revenues on resource wealth, low saving rates, highly volatile resource revenues, and crowding-out of other activities.
Fourth, efficiency-seeking FDI is mainly driven by lower labour costs and higher productivity. In the case of labour costs, existing evidence in the literature is far from conclusive.[15] This type of investment is generally expected to be directed towards EMEs with large supplies of cheap labour (e.g. China and Vietnam) for the development of low value added economic activities.[16]
Research confirms the important role played by institutional quality in determining IFDI.[17] Low institutional quality implies a higher cost of doing business and higher transaction costs.[18] MNEs are likely to avoid countries with high instability, as it can imply sudden changes in the legal framework and a higher risk of expropriation.[19] Similarly, they tend to avoid countries with high levels of corruption and bureaucracy, as they imply a direct extra cost of doing business.[20] On the other hand, compliance with the rule of law and private property rights are valued positively by MNEs. Similarly, ease of doing business (e.g. in terms of access to finance, trade regulation and the number of steps needed to start a business) is another significant driver of inward FDI.[21]
Finally, macroeconomic stability is another relevant driver of inward FDI. The absence of large swings in inflation and exchange rates in a host country is a localisation advantage that can attract FDI by lowering risks related to the expected value of assets and profits generated abroad.
Emerging countries’ MNEs (EMNEs) have specific motivations when investing abroad. EMNEs differ from advanced economies’ MNEs in that they tend to be characterised by a lack of ownership advantages and international experience and are subject to low institutional quality at home.[22] In addition, they also differ as regards the prominent role still played by state-owned MNEs in emerging economies. For EMNEs, therefore, investing abroad is aimed first and foremost at becoming globally competitive by filling their competitiveness gap.[23] Thus, EMNEs seek to acquire technology and managerial skills and to access highly qualified labour – all factors that are scarce in their home country or would be costly to develop internally. Another distinctive characteristic of EMNEs is that, especially where natural resources are concerned, they appear to be more willing to operate in host countries with low institutional quality than MNEs from advanced economies.[24] Box 1 provides an overview of the activities of the largest MNEs originating from both advanced and emerging economies in terms of their economic performance, capital intensity and overall economic relevance.
The internationalisation of EMNEs is affected by the policies of their national governments, which are often pursued via state-owned enterprises. China is a prime example. Government initiatives such as the “Go Global” policy, the “One Belt One Road” initiative and “China Manufacturing 2025” are fostering and shaping Chinese corporate investment abroad.[25]
Box 1
MNEs and their investment deals
Based on real economy indicators, such as foreign activity, the biggest MNEs still originate predominantly from large, advanced economies and the manufacturing sector, although EMNEs and the services sector are growing in importance. According to UNCTAD’s 2015 ranking of the world’s 100 largest MNEs, only eight were EMNEs. Moreover, 62 came from just four countries: the United States (21 companies), the United Kingdom (17), Germany (13) and Japan (11). More than half of these MNEs operate in the following sectors: motor vehicles; mining, quarrying and petroleum; pharmaceuticals; electricity, gas and water; petroleum refining; and, within the services sector, telecommunications. Of the ten largest MNEs by market capitalisation in 2016, half were in the information and communications technology (ICT) sector.[26]
The world’s largest MNEs according to the UNCTAD classification play a prominent role in terms of employment, sales and assets in the host countries in which they operate. The foreign activities of these firms are impressive even when compared with some nation states: the top company in terms of employment abroad has 800,000 employees, which is larger than Estonia’s total labour force; the foreign sales volume of one of the most prominent automotive corporations (USD 190 billion) is equivalent to the annual GDP of countries like Greece and Portugal; and the foreign assets held by the largest oil company (USD 290 billion) are close to the annual GDP of economies such as Ireland and Colombia. Similarly, the market capitalisation of one of the most prominent ICT corporations (2016: around USD 600 billion) is on a par with the GDP of Argentina.[27]
Comparing the 92 biggest MNEs from advanced economies with the 100 biggest EMNEs, on average the former recorded 4% higher sales per employee than the latter in 2015. In addition, the capital/labour ratio of advanced economies’ MNEs was 31% higher, and the relative importance of their economic activity abroad, as measured by the foreign activity index,[28] was 26% higher (see Chart A).
Chart A
Main features of MNEs by country
(left-hand scale: percentages; right-hand scale: ratios)
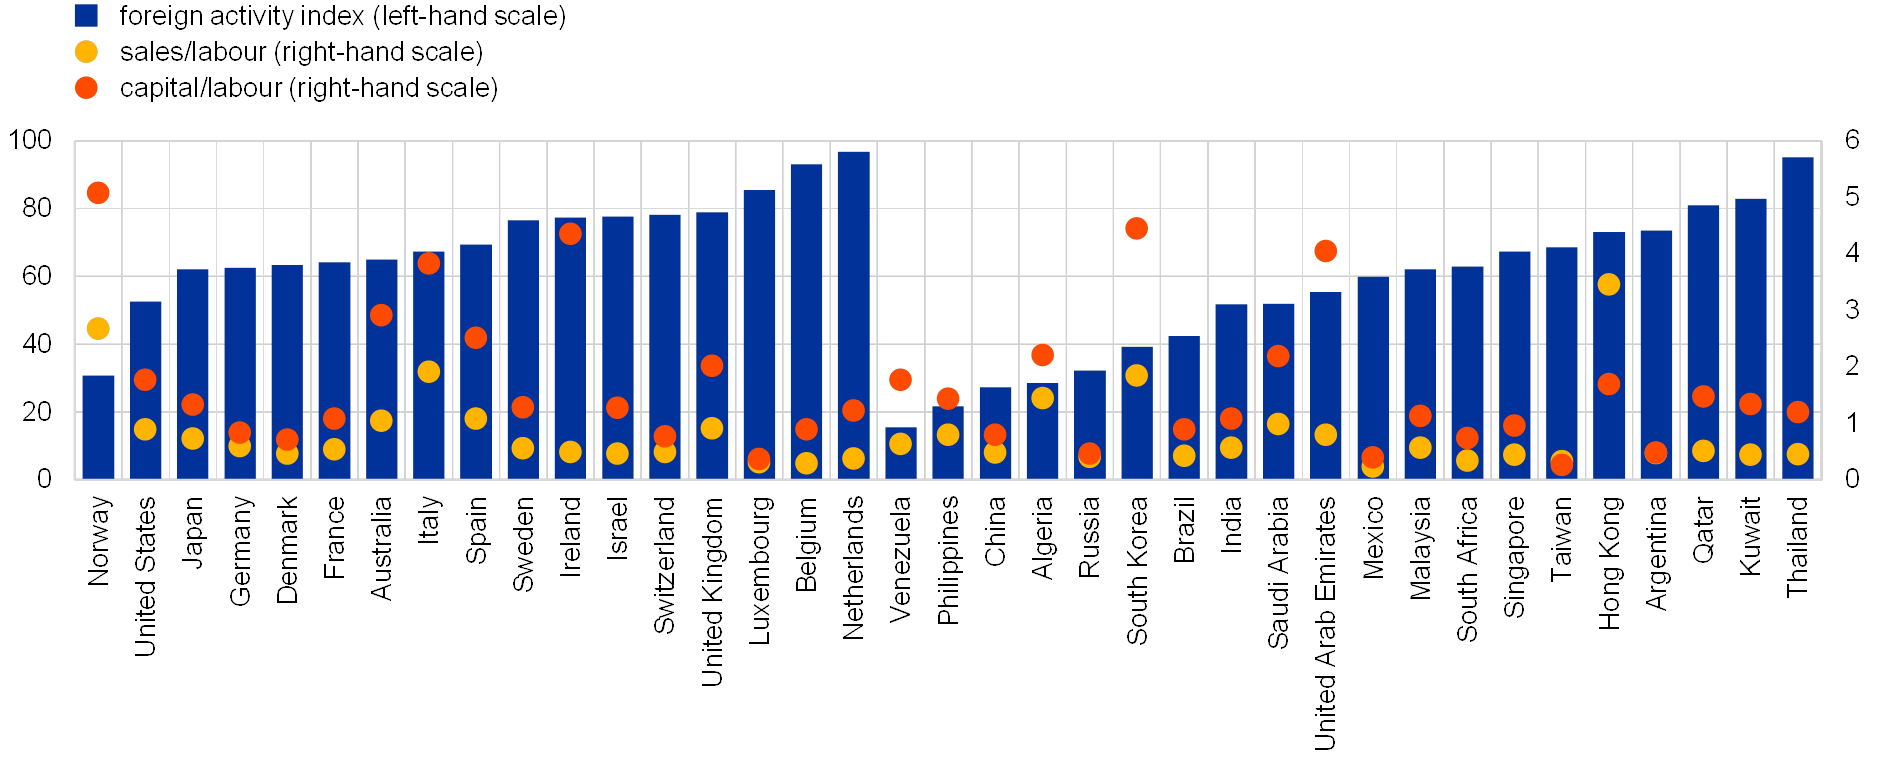
Sources: UNCTAD, World Investment Report 2016 – Investor Nationality: Policy Challenges, United Nations, 2016; and UNCTAD (2017), annex tables 24 and 25 respectively.
Notes: Data refer to the year 2015 and cover the world’s 100 largest MNEs and the 100 largest EMNEs. The foreign activity, sales/labour ratio and capital/labour ratio indicators are averaged by country.
Total global FDI is dominated by a relatively small number of very large deals. In 2016 – the last year for which complete data are available – nearly 21,000 FDI projects took place, with a volume of almost USD 1.8 trillion. Out of these projects, 215 M&A deals accounted for 55% of the total volume. In terms of the number of M&A projects worth more than USD 1 billion, the main investors were the United States (18.6%), China (15.4%) and the United Kingdom (8.4%), while the main recipients were the United States (33%), the United Kingdom (11.2%) and Germany (4.7%). Interestingly, about 58% of these very large deals occurred in the services sector.[29]
4 FDI and exports: substitutes or complementary?
When serving a foreign market, FDI and exports have traditionally been seen as substitutes. The underlying idea is that an MNE might prefer to invest abroad rather than export from home in order to forestall the risk of its technological advantage being lost to competitors[30] and to avoid costs such as transportation costs, tariffs and anti-dumping measures[31] (“horizontal FDI”). Through horizontal FDI a firm can exploit its know-how and technological capabilities without them being appropriated by third parties, as might more easily happen through the functioning of supply chains.
In reality, MNEs often complement their exports by owning subsidiaries abroad.This has led to MNEs having an increasing share of world trade.[32] In addition, existing evidence in the literature suggests that there is a positive correlation between a country’s capacity to attract FDI and its level of trade openness.[33] This raises the question of which types of FDI are positively correlated with trade openness and exports from the source to the host country.
First, by means of vertical FDI, MNEs distribute and optimise their production across borders. Headquarters and subsidiaries perform specific economic activities, rather than broad ones, and the different productive sites are linked via trade (i.e. imports and exports).[34] This type of investment is efficiency-seeking in nature: MNEs exploit different characteristics across countries in order to minimise costs. As a result, global production processes become more fragmented as firms locate their production and source their inputs across national borders.
Second, FDI can also serve as a tool for enhancing the market penetration of exports. Export-supporting FDI refers to MNEs’ investment in the wholesale and retail sector.[35] Under this model, the MNE sets up a subsidiary in a foreign country in order to import and distribute its goods or services. In this case, unlike in the case of horizontal FDI, bilateral exports of final goods and FDI are positively correlated.
Third, MNEs also invest abroad in order to supply the host country and third countries directly with their products. “Export-platform FDI” is aimed at serving regions in a way which can either complement or substitute exports.[36] This investment strategy, which is typically directed at countries belonging to a common market, will be pursued if the production costs in the home market and trade costs of serving a given foreign market together are higher than the costs of producing and exporting from a third country. This type of investment does not necessarily entail the replication of the firm’s entire economic activity abroad, as trade in intermediates and services will probably take place between the firm’s headquarters and its foreign subsidiaries, thereby contributing to the functioning of global value chains.
Trade liberalisation policies are expected to affect each of the aforementioned types of FDI – horizontal, vertical, export-supporting and export-platform – in different ways. They are likely to hamper horizontal FDI, as they reduce trade costs and thus reduce the incentive to produce in foreign markets instead of exporting. Bilateral trade liberalisation involving “deep” trade agreements (e.g. including non‑trade provisions on investment and competition, legal and institutional provisions, and economic collaboration) tends to facilitate vertical and export‑supporting FDI. The profitability of both strategies increases as trade costs fall. For export-platform FDI, the relationship is more ambiguous, as its nature can vary from being purely horizontal to being similar to export-supporting FDI. Nevertheless, it will always seek to serve not only one country but a whole region.
Box 2 focuses on the relationship between M&As and the value added that is embedded in exports. The results obtained show a complementarity between M&As and exports from the source to the host country, mostly owing to export‑supporting FDI.
Box 2
The relationship between M&As and the value added embedded in exports
To investigate the relationship between M&As and exports, an augmented gravity model is estimated. This model sheds light on how M&A investments from source country i to host country j are affected by different measures of export flows from i to j. We estimate the following equation:[37]
In this way, this model takes into account the economic size of the source and destination countries (), their capital intensity difference (), whether they share a currency (), the existence of a preferential trade agreement () or a bilateral investment treaty and the institutional quality in the home and host countries ().[38] The variable of interest is , which denotes the extent to which variation in exports from the source to the host country in a given year affects M&As. Under the substitution hypothesis (i.e. horizontal FDI), a negative correlation is expected, while a positive correlation would imply complementarity between M&As and exports (i.e. vertical FDI or export-supporting FDI).
This analysis is based on a bilateral M&A database from Thomson Reuters, which is combined with the World Input-Output Database (WIOD). The dataset covers the period 2000‑14 and 41 source and destination countries, representing more than 80% of world trade, M&As and GDP during the period. The M&A database allows the number of M&A projects and their value to be studied separately, with the former referring to the capacity to create new bilateral relationships and the latter to the capital flow. The WIOD database allows exports of final and intermediate goods to be considered separately, as well as the value added embedded in them. Thus, the domestic value added embedded in final and intermediate goods exports, the domestic value added which returns home via final and intermediate exports, and the foreign value added embedded in final and intermediate goods exports[39] are considered separately in the analysis. By using the value added embedded in exports, as opposed to gross exports, it is possible to account for the domestic and foreign inputs used for exporting. Moreover, the issue of double counting of exports and imports is avoided.[40]
Table A
M&As and the value added embedded in exports
(results from estimating the gravity model; dependent variable: M&As)
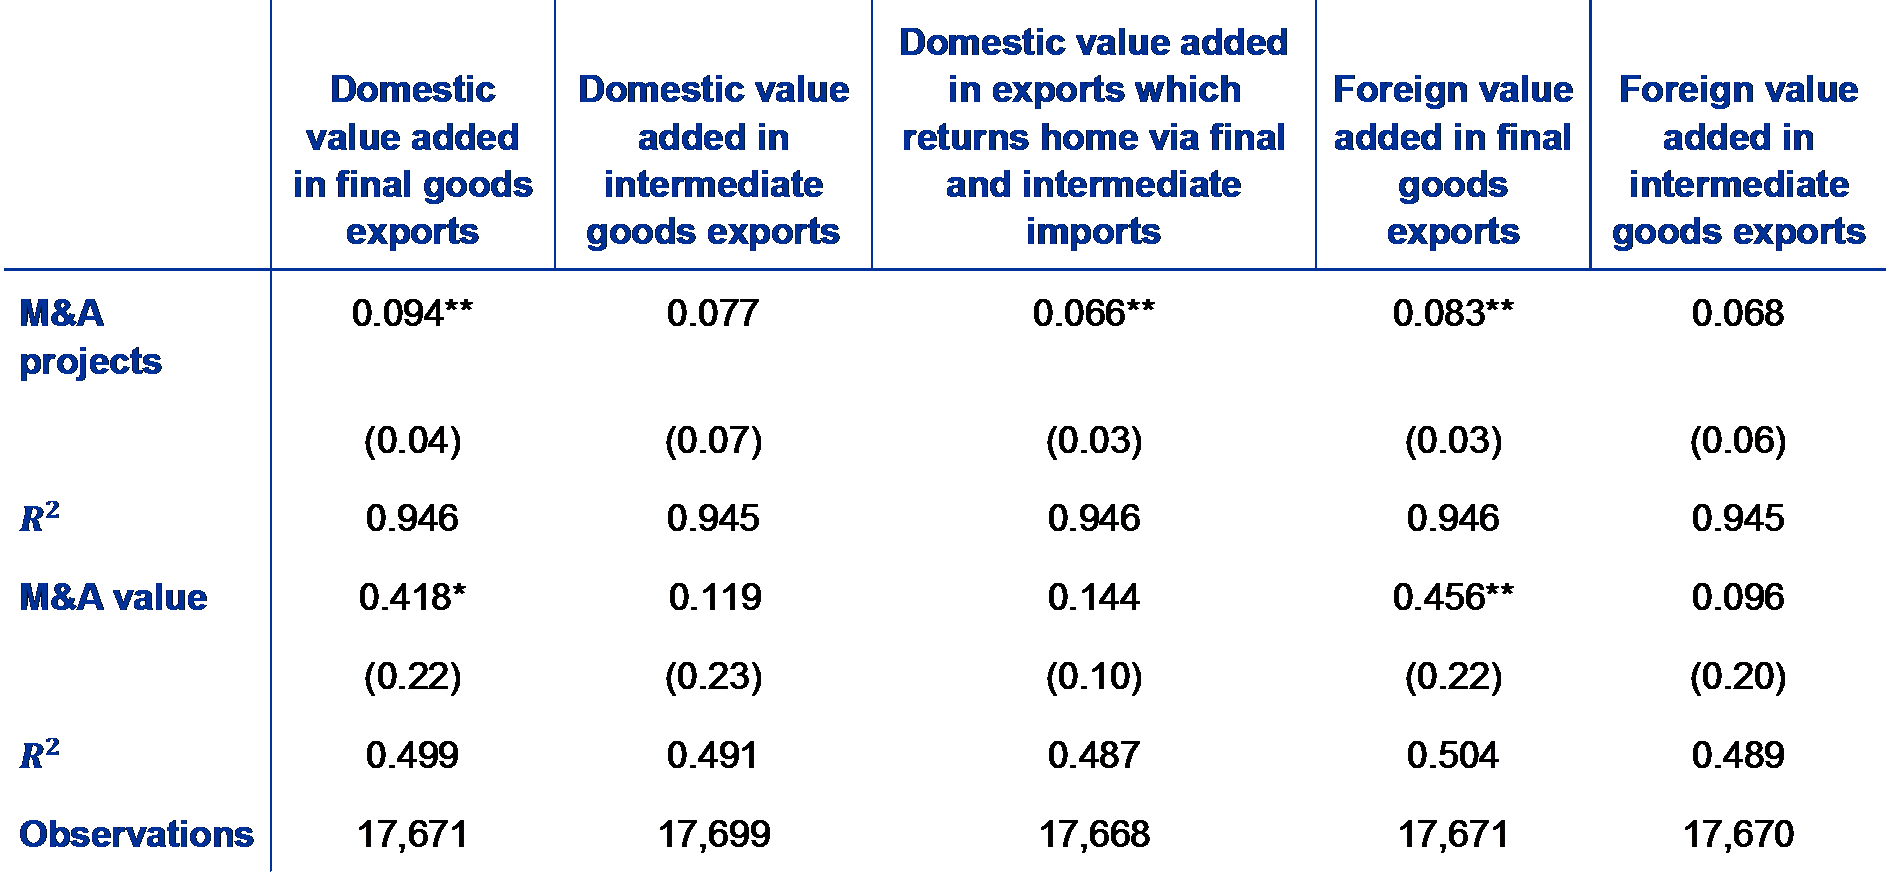
Sources: Thomson Reuters, WIOD (2016 release) and ECB calculations.
Notes: Robust standard errors in parentheses, clustered at the country-pair level.
*** p-value<0.01; ** p-value<0.05; * p-value<0.10.
The estimation results in Table A show that M&As are mainly export-supporting and, to a significant extent, vertical. Exports of final goods, irrespective of the domestic or foreign value added embedded in them, have a positive impact on the number of M&A projects and their value. This finding suggests that M&As are mostly export-supporting. By contrast, overall exports in intermediate goods do not have any effect on either the number of projects or their value. However, in terms of the number of projects, domestic value added in exports which returns home via final and intermediate imports processed abroad does have a positive impact. All in all, this last result provides some evidence of vertical FDI being positively correlated with the exporting of intermediate goods which are processed abroad before returning home.
5 Foreign direct investment in the EU and the euro area
The process of economic, monetary and institutional integration in the EU has been a key driver of FDI. As shown by the analysis in Box 3, joining the EU and the euro area is estimated to have boosted bilateral FDI flows among members by sizeable amounts.
Restrictions on inward FDI across the EU are, on average, lower than in OECD countries. While they are not homogeneous across EU Member States, the restrictions on inward FDI in the EU are, with only two exceptions, lower than the OECD average. According to Chart 4, which shows IFDI regulatory restrictions in 2016, all EU countries apart from Austria and Poland have lower restrictions than the OECD average. However, while countries like Luxembourg, Slovenia and Portugal have virtually no restrictions, Austria, Poland, Sweden, Italy, Slovakia and France are significantly above the EU average. At sectoral level, EU Member States have almost no restrictions on FDI in the manufacturing sector, while restrictions in the primary sector are generally larger than in the services sector.
Chart 4
Restrictions on inward FDI in 2016
(level of restrictions on IFDI)
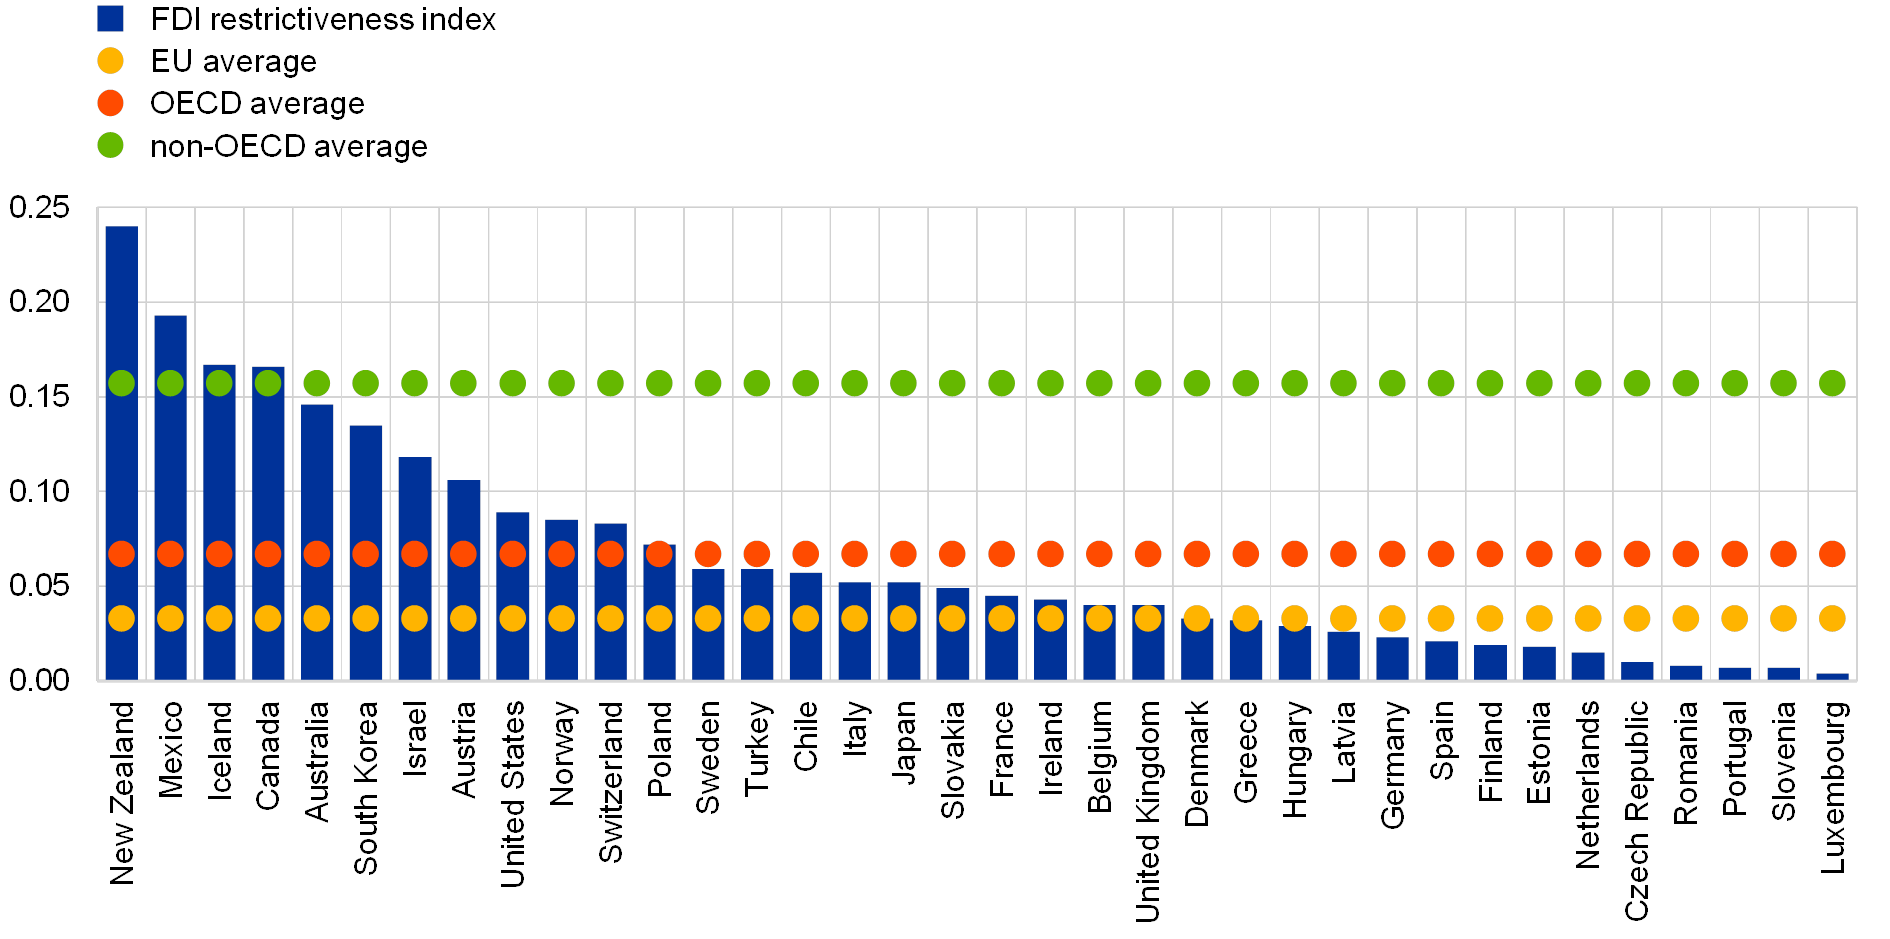
Source: OECD FDI Regulatory Restrictiveness Index.
Notes: The OECD’s FDI Regulatory Restrictiveness Index measures regulatory restrictions on foreign direct investment across 22 economic sectors. It gauges the restrictiveness of a country’s FDI rules by focusing on four main types of restriction on FDI: (i) foreign equity limitations; (ii) discriminatory screening or approval mechanisms; (iii) restrictions on the employment of foreigners as key personnel; and (iv) other operational restrictions, e.g. restrictions on branching and capital repatriation or land ownership by foreign‑owned enterprises.
The EU’s weight in global IFDI decreased after 2007, but has rebounded somewhat since 2015. Although, on average, EU restrictions on IFDI are significantly below both the OECD and the non-OECD average, the combined share of EU Member States in global IFDI declined significantly in the period 2008‑14, before partially recovering. Chart 1 illustrates the distribution of world IFDI across three country clusters: the EU (including intra-EU IFDI), other advanced economies and EMEs. Before 2008 EU countries were the main recipients of global FDI. On average, between 2000 and 2007, EU countries attracted 43.1% of the world’s FDI, while other advanced economies attracted 23.8% and EMEs 33%. By contrast, in the period 2008‑16 there was a significant shift in the distribution of FDI in favour of EMEs and to the detriment of the EU. In this period the EU attracted, on average, only 26.7% of the world’s FDI, while 25.2% went to other advanced economies and 48.1% went to EMEs.
The Great Recession triggered by the financial crisis of 2007‑08 has adversely affected the EU’s capacity to attract FDI. As Chart 5 shows, between 2000 and 2015, IFDI was more volatile in non-euro area EU countries than in the euro area. Accordingly, the drop in IFDI into the EU owing to the crisis has been more marked in non-euro area EU countries. The gradual decline in IFDI into euro area economies has been driven mainly by the drop in FDI from non-euro area EU countries and by the euro crisis in 2012. Meanwhile, for non-euro area EU countries, there has been a significant decline in IFDI received from all EU Member States since 2008.
Since 2007 the EU’s position as a source of FDI within the region has also been in decline. For euro area countries, other euro area countries continue to be the main source of FDI, but their weight gradually decreased during the first years of the Great Recession. In addition, intra-euro area FDI plunged in 2012 (see Chart 5). For non-euro area EU economies this trend has been even more severe: in 2008 euro area countries accounted for 70% of total IFDI into non-euro area EU countries, but by 2014 that share had fallen to 50%.
Chart 5
Inward FDI flows by origin
(left-hand scale: IFDI into the euro area by origin, percentages; right-hand scale: total IFDI into the euro area, USD billions)
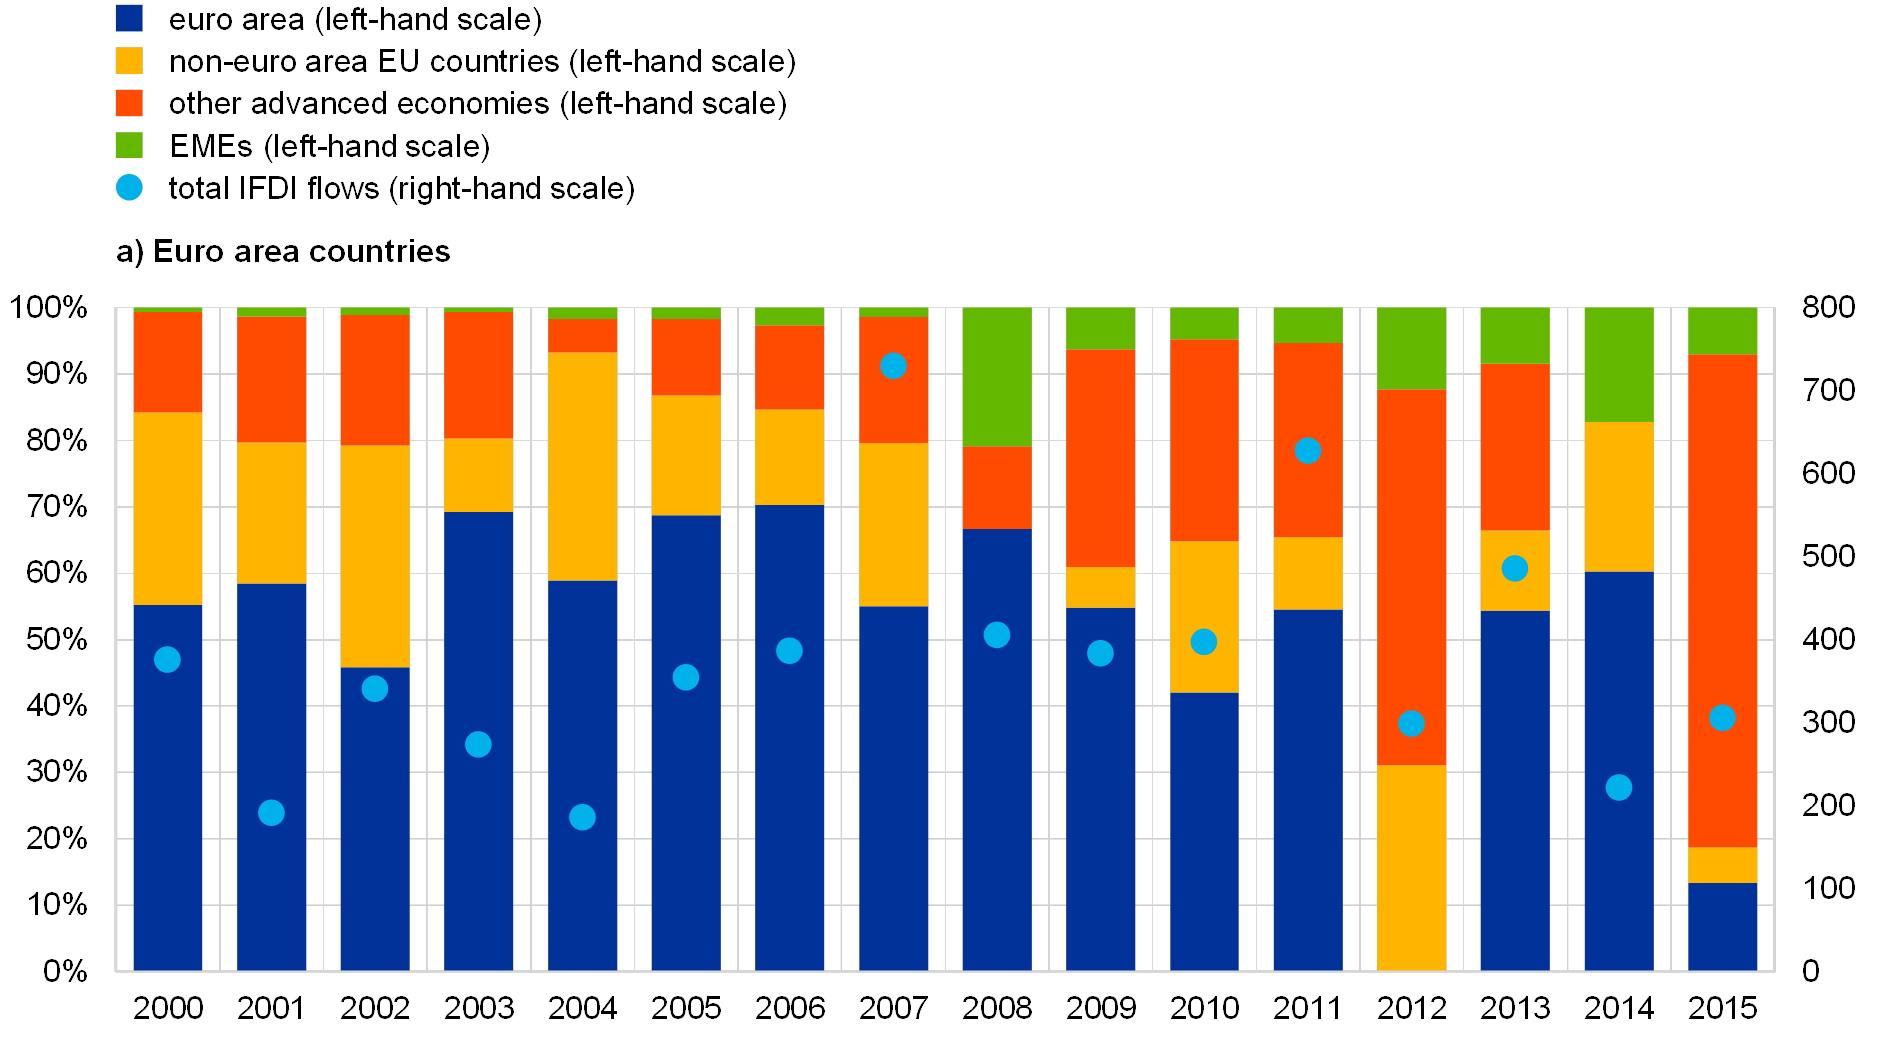
(left-hand scale: IFDI into non-euro area EU countries by origin, percentages; right-hand scale: total IFDI into non-euro area EU countries, USD billions)
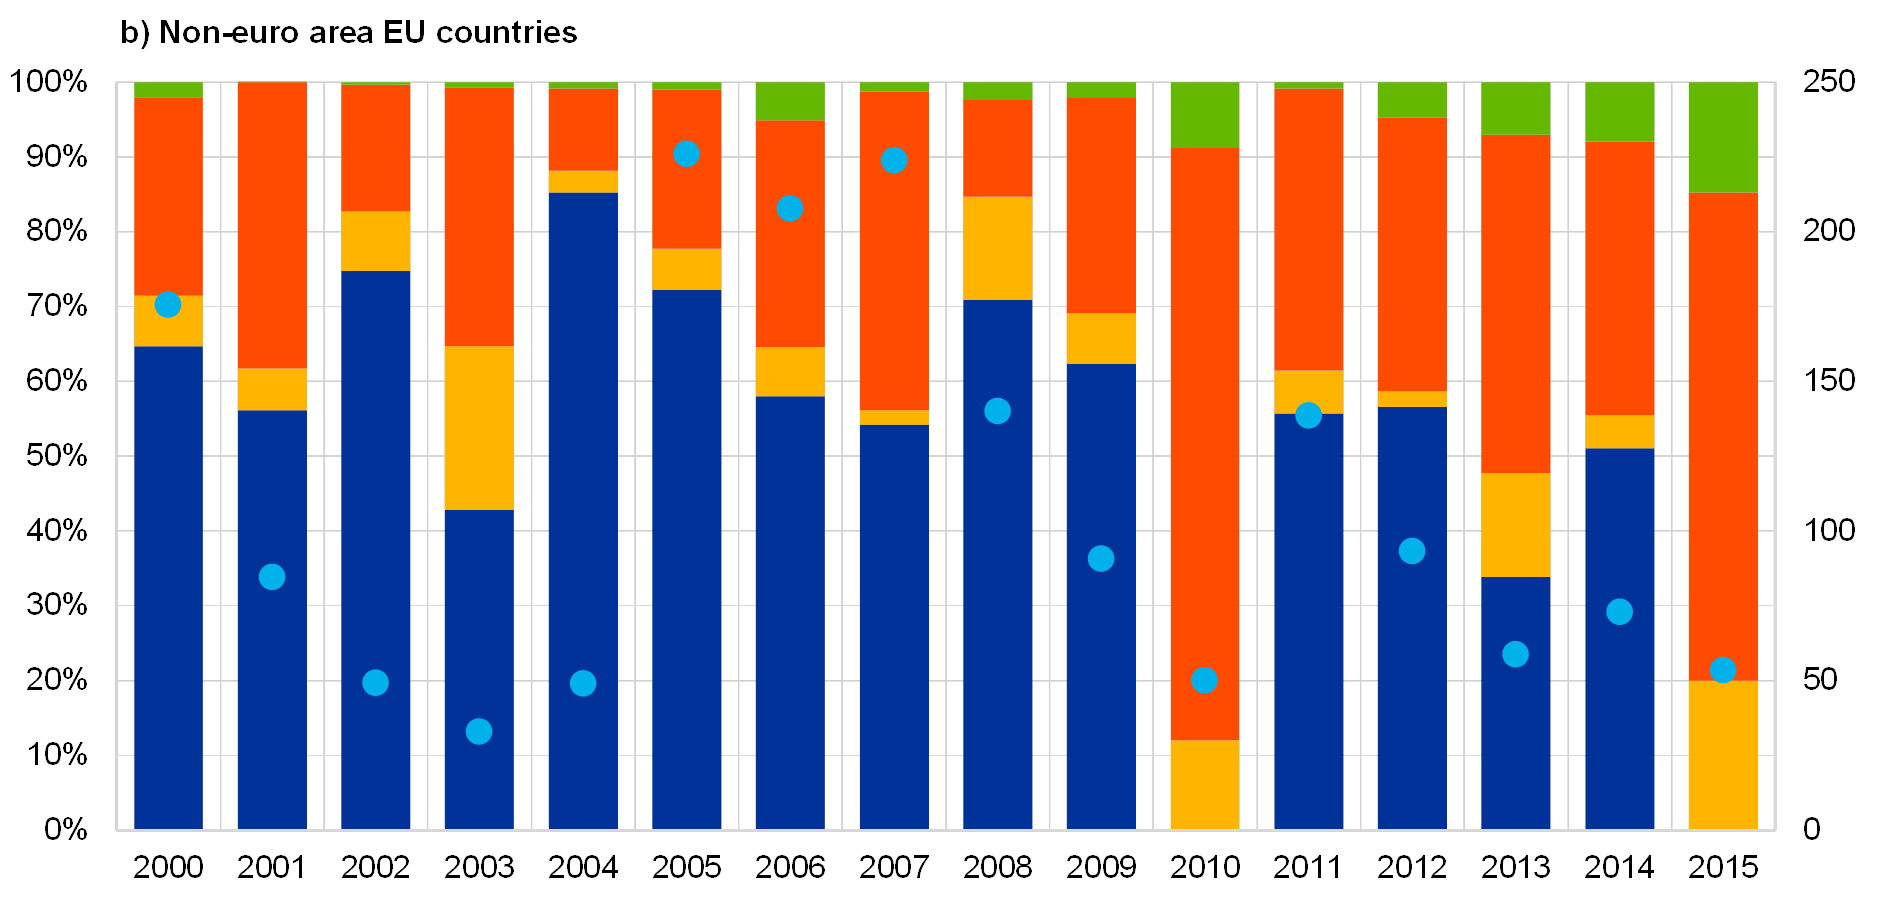
Source: OECD BMD3 and BMD4 inward FDI statistics.
Note: BMD3 and BMD4 are the OECD Benchmark Definition of Foreign Direct Investment – third and fourth editions.
Like the rest of the world, the EU has been witnessing a surge in new investors.Chart 5 shows that the share of FDI from EMEs has significantly increased since 2008 (especially in the euro area), with the top three investors being China, Singapore and Brazil. FDI from EMEs into the EU is mostly driven by a desire to access EU markets and to acquire technologies and brands.[41]
In line with the global trend, EU countries are increasingly investing in EMEs.Outward FDI from EU Member States presents a similar pattern to IFDI. As Chart 6 shows, OFDI from the euro area has been less volatile than OFDI from non-euro area EU countries. While the total volume of OFDI flows from the euro area remained stable during the period 2008‑15, for non-euro area EU countries there was an appreciable slowdown. At the same time, both euro area and non-euro area EU countries have significantly shifted the destination of their OFDI in favour of EMEs. This trend can be explained by the sovereign debt crisis, increased economic uncertainty and the low economic growth suffered by most EU countries until recently. In this context, EU MNEs partly reduced their investments abroad and partly re-directed their investments towards fast-growing EMEs with high market potential. Many EU MNEs reduced their investments abroad, particularly in the case of non-euro area EU countries, whose share of OFDI flows to other EU members declined to only 13% in the period 2012‑15. Nevertheless, as the economic recovery strengthens, intra-EU FDI is likely to recover.
The latest challenge that the EU is facing is the United Kingdom’s upcoming departure from the EU (Brexit). While the impact of Brexit is uncertain, most studies have estimated a reduction in FDI into the United Kingdom of between 12% and 28%.[42] Indeed, Brexit could significantly increase the cost of accessing the EU Single Market from the United Kingdom, making the country less attractive for foreign investors. In addition, changes in regulation that might take place in the United Kingdom after exiting the EU could make doing business in the United Kingdom more costly for EU MNEs.
Chart 6
Outward FDI flows by destination
(left-hand scale: euro area countries’ OFDI by destination, percentages; right-hand scale: total euro area OFDI, USD billions)

(left-hand scale: non-euro area EU countries’ OFDI by destination, percentages; right-hand scale: total non-euro area EU OFDI, USD billions)
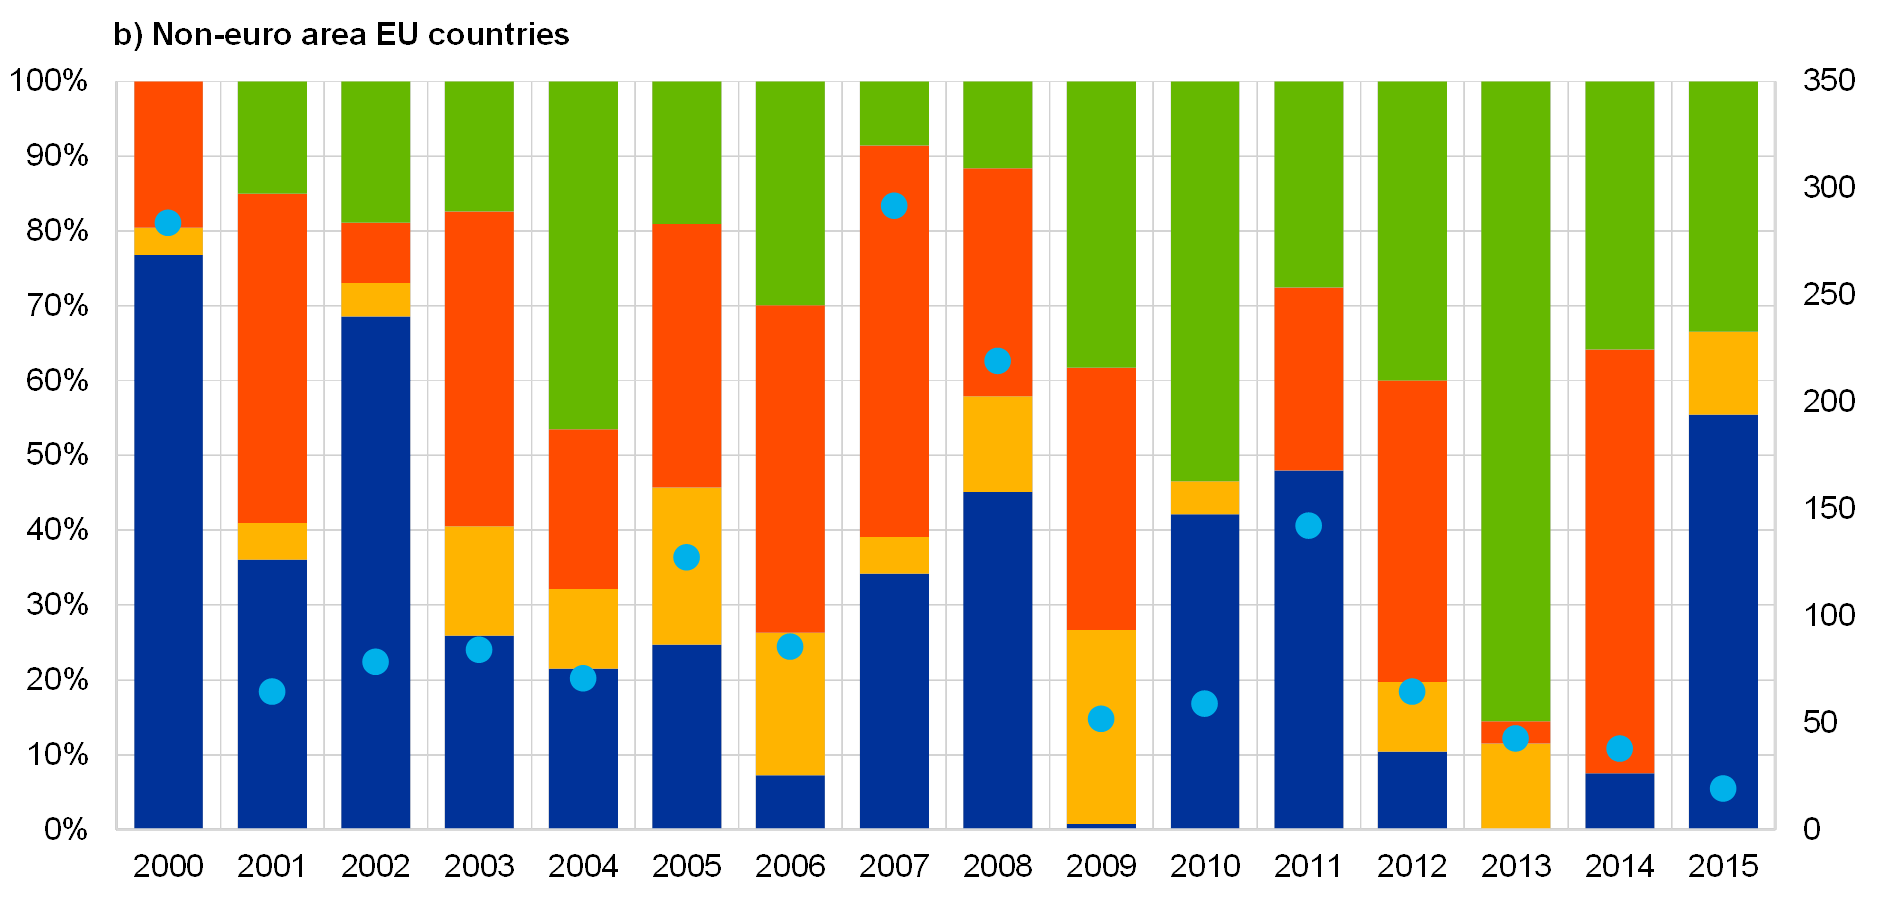
Source: OECD BMD3 and BMD4 outward FDI statistics.Note: BMD3 and BMD4 are the OECD Benchmark Definition of Foreign Direct Investment – third and fourth editions.
Box 3
The impact of EU and euro area integration on FDI flows
The economic impact of regional integration in Europe has been widely addressed in the literature. The main focus has been on the impact on trade, but some studies have also given insights into how the EU and, in particular, the euro area have affected FDI among their members. These studies[43] tend to show significant growth in FDI among EU Member States. As regards EU membership, the estimated increase in FDI ranges between 28 and 83 percentage points, while the incremental effect of euro area membership ranges between 21 and 44 percentage points. However, these studies consider different periods and different sets of countries, so they are not fully comparable and they measure the impact of EU accession and euro adoption for different countries.
In order to overcome these issues, we use a bilateral FDI flows database covering the period 1985‑2012 for 34 host countries and 70 source countries.[44]The countries and time period covered mean that we take into account the accession of 17 countries into the EU and the whole process of Economic and Monetary Union (EMU). We estimate the following equation:[45]
where represents the FDI flows from one country to another. With this model we take into account the demand and supply sides (), the capital intensity difference between a pair of countries (), whether countries have signed a preferential trade agreement () or a bilateral investment treaty (), the economic size similarity () and the difference in human capital endowment between the source and host country (). Moreover, the equation controls for the real exchange rate () and a set of institutional indicators to account for institutional quality.[46] Our variables of interest are , which is a dummy that takes the value 1 in year t whenever a pair of countries are EU members, , which is a dummy that takes the value 1 in year t whenever a pair of countries belong to the euro area, and , which is a dummy that takes the value 1 in year t whenever the destination country is an EU member.[47]
The results indicate that, on average, joining the EU increased inward FDI flows from other EU countries by 43.9%, but did not have a significant impact on a country’s capacity to attract FDI from non-EU countries. On average, adopting the euro increased FDI from other euro area members by 73.7%. Thus, the additional effect of belonging to the common currency area can be estimated at around 20%.[48]Indeed, the EU reduced the cost of doing business across the borders between its members, and the euro area stimulated cross-border capital flows among its members, as exchange and liquidity risk were eliminated.[49] The results also indicate that membership of the EU and the euro area partially mitigated the negative trend in IFDI after the Great Recession that was highlighted in the previous section.
6 Conclusions
The prominence of FDI has increased significantly over the past 16 years, rising from 22% to 35% of world GDP. FDI has traditionally originated from advanced economies, but two important developments have occurred since the Great Recession:
- EMEs have gained in weight both as recipients and as sources of global FDI. Since 2013 EMEs have managed to attract more than 50% of total inward FDI and have provided nearly 30% of total outward FDI.
- At the same time, the share of IFDI flowing into and OFDI flowing from advanced economies, in particular the EU, has been gradually decreasing.
FDI is carried out by the most productive firms in source countries via M&As and GI. The relevance of each type of investment varies depending on the source and destination countries concerned and the sector towards which it is directed. FDI flows are largely driven by relatively few deals. More specifically:
- Looking at IFDI, M&As are the main mode of entry into EU countries and other advanced economies, while GI is the most common form of IFDI in EMEs. Regarding OFDI, M&As and GI are similar in importance for the EU and other advanced economies, whereas GI is the preferred form of FDI for EMEs. Nearly 70% of M&As are directed towards the services sector, while GIs are evenly distributed between manufacturing and services.
- The largest MNEs tend to come from advanced economies. Some are so large in terms of sales, assets and number of employees that they are comparable in size to the GDP and labour force of entire countries. Total FDI is driven largely by a small number of very large M&A deals. In 2016 very large M&As accounted for only 1% of the world’s FDI projects, but 55% of total FDI flows. The majority of these deals focused on the acquisition of firms in the services sector.
FDI has the potential to produce several positive effects on host economies.Market‑seeking FDI is channelled towards catching-up economies with market potential, whereas asset-seeking FDI is aimed at securing access to new or complementary capabilities for MNEs. Natural resource-seeking FDI is directed towards EMEs, but large natural resource endowments in a host country can also deter FDI under certain circumstances. Efficiency-seeking FDI is mainly driven by low labour costs. High institutional quality, ease of doing business and macroeconomic stability can help attract FDI, as these factors reduce the adverse risks associated with investment. Finally, M&As are mainly complementary to trade, rather than a substitute for it.
Turning to Europe, EU and euro area membership has fostered FDI among members. EU countries have, on average, fewer restrictions on FDI than the rest of the world. Since the Great Recession, however, the EU is no longer the world’s main FDI investor and recipient and its share has gradually declined. However, the decline in IFDI and OFDI has been more marked for non-euro area EU countries than for euro area countries. The latter have continued to receive sizeable IFDI flows, stemming mainly from other advanced economies outside of the EU.