FACT: “Section 301” contribution to U.S. inflation rate; range of estimates: 0.3% to 1.3%?
THE NUMBERS:
U.S. goods imports from China
Jan.-Feb. 2022 $90.1 billion
Jan.-Feb. 2018 $84.6 billion
WHAT THEY MEAN:
Reviewing her limited short-term options for easing inflation, Treasury Secretary Janet Yellen last week noted possible removal of Trump-era tariffs on Chinese goods. Three bits of background data on these tariffs, then some tentative conclusions:
1. Scale: Tariff System Roughly Doubled in Size: In 2017, the last full year before imposition of the administration’s “Section 232” and “Section 301” tariffs,* the U.S. tariff system brought in $32.9 billion in revenue on $2.34 trillion in imports. Dividing tariff revenue by import value, this yields a “trade-weighted” tariff average of 1.4%, though in a system (as PPI’s Ed Gresser noted in testimony last week) very unevenly weighted toward taxation of consumer goods and low-income families. By 2019, the administration had added to this system a battery of administratively imposed tariffs, including: (a) “232” tariffs of 25% on steel and 10% on aluminum, valued in 2017 at about $50 billion; (b) “301” tariffs of 7.5%, 10%, and 25% on about $350 billion in Chinese goods, and (c) a few smaller decisions such as “201” or “safeguard” tariffs on washing machines and solar panels.
In 2021, all this brought in $85 billion on $2.83 trillion in imports, essentially doubling the overall U.S. tariff average to 2.9%. As of early 2022, the Biden administration has unwound some of the metals tariffs through agreements with the EU, Japan, and the U.K.; the tariffs on Chinese goods, though with some promise of a revived “exclusion” process for businesses especially damaged by extra tariff costs remain in place.
2. Effects on U.S. Imports from China Noticeable but Modest: China’s share of U.S. imports has dropped, but the actual value of imports from China is now above pre-tariff levels. More precisely, imports of Chinese-made and -assembled goods totaled $506 billion in 2017, or 21.6% of overall U.S. imports. The Chinese import total dropped temporarily after the 301 tariffs went into effect over the course of 2018 and early 2019, to $451 billion or 18.1% of a $2.493 trillion 2019 total. By 2021, though, they had rebounded to $505 billion — essentially equal to the figure for 2017, though this was a smaller share of a much expanded $2.83 trillion U.S. import total.**
3. Little if Any Effect on China’s Overall Exports: The larger “301” impact on China’s global trade seems very small. Statistics published by China’s Ministry of Commerce show Chinese worldwide exports at $2.42 trillion in pre-tariff 2017, then $2.66 trillion in 2018 and a slightly dented $2.64 trillion in 2019, followed by a post-COVID surge to $3.3 trillion in 2021. This suggests that any damage to China’s export economy was small and quickly healed.
4. U.S. Economy and Inflation: Finally, returning to the Treasury Secretary’s concerns and setting trade flows aside, tariffs are generally an unattractive form of taxation. This is because they not only directly raise the cost of imported goods as a sales or excise tax would, but in contrast to sales or excise taxes, they also enable rent-seeking price increases throughout the domestic economy. These neither increase supply nor move demand towards an equilibrium, and therefore have both growth-reducing and inflation-encouraging effects.
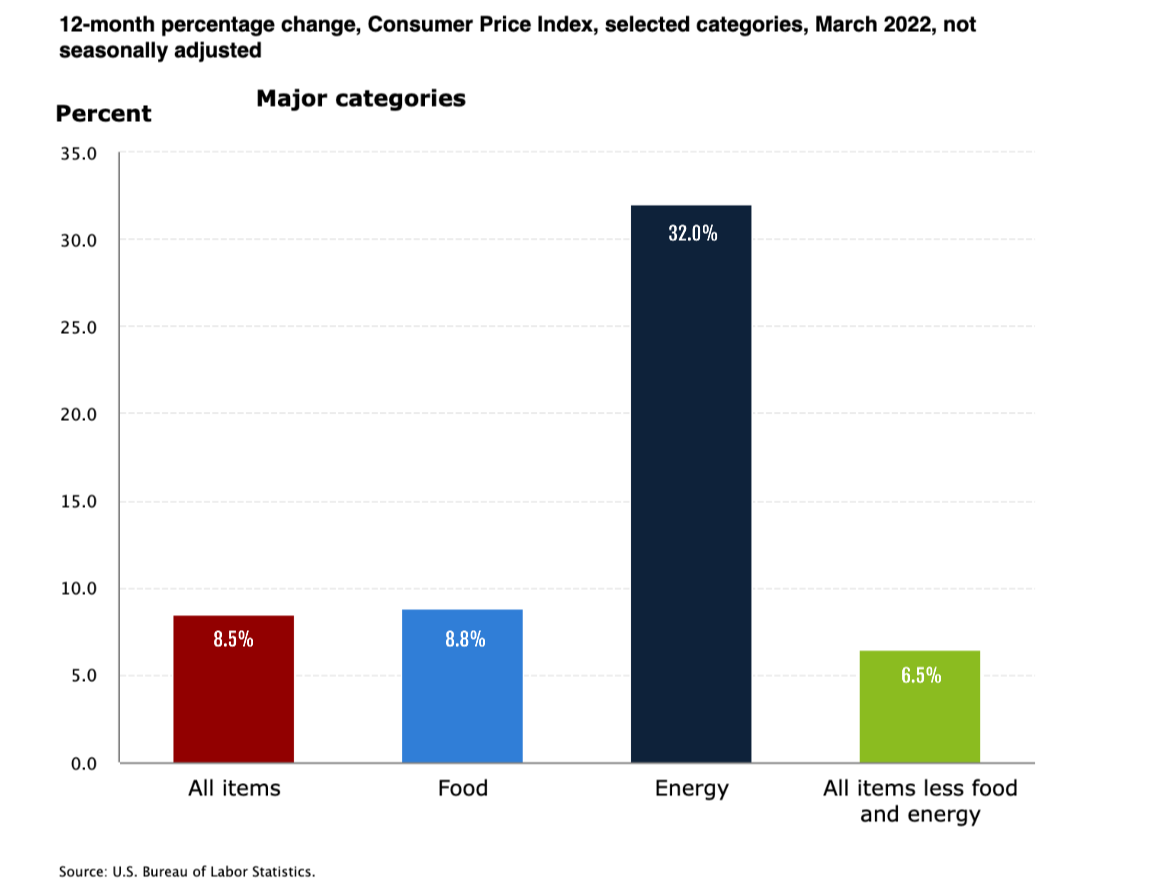
Taken as tax policy, the “232” tariffs on steel and aluminum raised metals-buyers’ tariff payments from $0.3 billion in 2017 to $3.2 billion in 2021, or by about $3 billion per year. The “301” tariffs are likewise focused on industrial inputs bought heavily by manufacturers and construction firms ($3 billion more on auto parts, $2.5 billion on electrical components, $1.1 billion on basic chemicals, and so on) and much more expensive. With Chinese import totals for 2017 and 2021 essentially identical, buyers paid $13.5 billion in tariffs in 2017, and $56.6 billion in 2021. Estimates of the 301 contribution to last year’s 7% spike in U.S. inflation range from 0.3% to 0.5% from higher import prices, to a more recent Peterson Institute estimate of 1.3% with domestic-price-raising effects included.
Hence Dr. Yellen’s interest. Her cautious comment on a potential decision to dial tariffs back: “There would be some desirable effects. It’s something we’re looking at.”
* “232” and “301” stand for sections of U.S. trade law. The 232 section enables Presidents to impose tariffs on ‘national security’ grounds; the 301 section enables them to impose tariffs as retaliation for overseas policies which impose a “significant burden on U.S. commerce”.
** On the other side of the trade-balance sheet, U.S. export trends to China followed a similar post-tariff-and-Chinese-
*** Had China retained the 21.6% share imports it held in 2017, the 2021 total would have been around $600 billion. (Assuming all else equal, of course.) Vietnam, whose exports to the U.S. jumped from $46 billion to $102 billion in these years, picked up about half of the missing $100 billion; secondary beneficiaries include India, Mexico, and a few other mid-income countries.
FURTHER READING
Tariffs, inflation, and prices
Treasury Secretary Janet Yellen on U.S. inflation and tariff options.
Former Treasury Secretary Larry Summers, commenting on a Peterson Institute study suggesting that Trump-era tariffs have added about 1.3% to inflation rates, argues that tariff reduction is the most readily available anti-inflation tool for administrations: “when you reduce the price of imported goods, you reduce the price of domestic goods as well. That turns out to be the larger of the two effects.”
Commerce Secretary Gina Raimondo & U.S. Trade Representative Katherine Tai announce scrapping of the steel and aluminum tariffs on U.K. metals (an extra $22 million on $0.45 billion in 2021 imports).
… and PPI’s Ed Gresser on a possible pro-poor reform of the permanent tariff system, through scrapping consumer goods tariffs that protect no jobs or production.
And U.S.-China trade background
The U.S. Trade Representative’s gloomy October report on China’s WTO compliance and U.S. policy reports lots of continuing problems, “Phase 1” agreement not well designed, outcomes mediocre at best.
China trade data from the Census Bureau (goods only), monthly and annual totals from 1985 forward.
And the WTO’s “Trade Profiles 2021” has a worldwide look at Chinese trade patterns.