Introduction
The growth of international trade is one of the defining trends of our time. While trade has shaped societies and economies for as long as societies and economies have existed, its impact over the past half century has been nothing short of extraordinary. During this time, trade volumes of goods and services increased 20-fold and now top $23 trillion. As a percentage of global GDP, exports now account for nearly one-third of global economic activity, a 100 percent increase since 19701. Technology plays a unique role in the international trade landscape. As a category, it represents one of the largest segments of U.S. trade. This reflects the insatiable demand of consumers and businesses for the latest and greatest in devices, applications, content – and by extension, the underlying digital infrastructure to make it all work. Additionally, as an enabling force, trade in technology goods and services creates its own virtuous cycle. The more technology is put into use, the more businesses and consumers have the tools to communicate, create, and exchange, thereby encouraging even more trade.
OVERVIEW
U.S. information technology exports reached an estimated $338 billion in 2018, an increase of 2.5 percent over the previous year. Growth slowed slightly compared to the 2017 rate of 4.5 percent. Since 2010, U.S. exports of technology added nearly $65 billion in new earnings and aggregate growth of 23 percent. Growth in the tech sector, especially as it relates to international trade, is a function of many factors. Macro technology trends, such as the ongoing push of digital business transformation, combined with economic conditions – are customers in the mood to buy, currency fluctuations, and government trade policies all have a bearing on growth.
Analysis of the export subsectors within the technology category reveal many of these factors. On a percent change basis, the information and data processing services subsector led all technology export categories in growth at 15.2 percent. The IT services category and the software/software-as-a-service category also performed well, recording growth of 5.9 percent and 4.5 percent, respectively. The growth in tech services and the “everything-as-a-service” model have been driving forces in the tech sector over the past decade. The migration to cloud computing, the modernization of legacy applications and workflows, and the mission-critical importance of data – and soon artificial intelligence (AI), translate to demand for expertise in integration, software development, data management, cybersecurity and related competencies categorized as technology services.
On the hardware front, also referred to as manufactured goods, the computing equipment category recorded the highest export growth at 7.4 percent. This was followed by navigational, measuring, and control equipment category (6.3 percent), and semiconductors and components (1.6 percent). As important as tech services, applications, and data have been to growth, these categories can only thrive when there is a large installed base of devices (think users with computers, tablets, mobile phones, etc.) and robust infrastructure that reliably delivers faster, higher capacity, and less costly computing and storage. Emerging technologies such as internet of things (IoT), edge computing, smart cities, and robotics require cutting edge processors and the components that form the “brains” of these intelligent solutions.
The one export category that notably lagged was telecommunications. Exports of communications equipment hardware fell -6.0 percent, a loss of $2.5 billion in revenue, while telecommunications services dropped -8.1 percent, a loss of nearly $900 million in revenue compared to the prior year. For context, the overall U.S. telecom market for equipment, services, and employment has been sluggish the past couple of years. In many markets, traditional wired telecom along with segments of wireless telecom, can be considered mature categories. Moreover, as the transition to 5G gets underway, both telecom providers and customers must contend with the uncertainty that comes with any disruptive shift.
Like most countries, the U.S. is both a buyer and seller of technology. U.S. businesses and consumers purchased nearly $500 billion in technology goods and services from overseas sellers in 2018. The net of technology exports from the U.S. and technology imports to the U.S. results in a trade deficit of nearly $161 billion. In tech services, the U.S. experienced a trade surplus of nearly $40 billion in 2018, a figure that grew 10.5 percent over the previous year. This is driven heavily by U.S. software (+$29.5 billion surplus), followed by information and data processing services (+$7.2 billion surplus).
In tech goods, the U.S. experienced a trade deficit of slightly over $200 billion in 2018, a figure that grew by 4.1 percent year-over-year. The largest deficit occurred in the communications equipment category, where U.S. buyers purchased $83.7 billion more in goods from overseas buyers than overseas buyers purchased from U.S. providers. The computing equipment category recorded a deficit of -$56.8 billion, followed by semiconductors (-$25.5 billion), and audio and video equipment (-$22.3 billion). China accounted for 84 percent of the deficit in tech goods trade with the U.S., down slightly from their 2017 rate of 87 percent. Since 2010, China’s share of the tech goods trade deficit has fluctuated between a high of 97 percent and a low of 84 percent. The next two largest trade imbalances for tech goods in 2018 belong to Malaysia (10 percent of the total deficit), and Mexico (also 10 percent).
Note: because the U.S. runs a trade surplus with the vast majority of its tech goods trading partners (82 percent surplus vs. 18 percent deficit), as a percentage of the total trade balance, some figures may appear to exceed 100 percent, which is a function of offsetting figures in the surplus column.
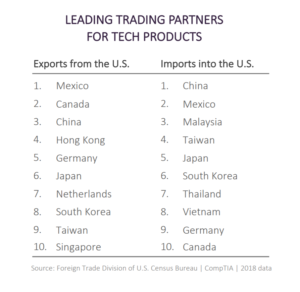
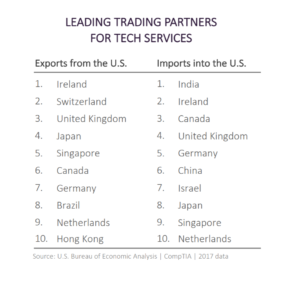
The top destinations for U.S. exports in 2018 was nearly identical to the previous year. The top four markets for U.S. tech product exports remained unchanged, while at #5, Germany moved up one slot, switching places with Japan at #6. U.S. tech services exports followed a similar pattern, with the top 10 markets consistent with the prior year. The one notable newcomer to the list was Hong Kong appearing at #10. See tables on following page.
Debate over the meaning of trade deficits has been a topic of discussion since the earliest days of international economic analysis. Given the many complexities of trade, confusion and concern are not uncommon. Because of limitations in how trade statistics are calculated, deficits can be mischaracterized and misinterpreted, which can be especially problematic for technology goods and services.
For example, the iPhone is designed in the U.S. by Apple and then an estimated two hundred suppliers from around the world provide the materials and parts that go into the final product. Lastly, the phone is mostly assembled in China. When shipped back to the U.S. for domestic customers, the entire wholesale value of the device is counted as an import from China. According the research consultancy IHS Market, Chinese assembly facilities capture only 3 to 6 percent of the total manufacturing costs of an iPhone, meaning nearly all of the value flows to Apple and other suppliers.
As noted by Louis Kuijs, head of Asia economics research at Oxford Economics, “if trade deficits were measured to account for the complex nature of global supply chains for products such as smartphones, the U.S.-China trade deficit would be about 36 percent lower.” This is but one example. The same principle applies to many tech product categories. See CompTIA’s supplemental brief for additional details on U.S.-China tech trade.
Another limitation with trade statistics is the difficulty in accounting for avoidance behaviors. This typically entails sellers in one country shipping their product to an intermediary country that may have more favorable trade terms with the final market destination. For example, tech goods from China sent first to Mexico and then onto the U.S. market. The data indicates Mexico recorded the largest gain of any country exporting tech goods to the U.S. market: +$5.5 billion in new sales or an increase of 9.2 percent. In the aggregate the figures generally hold, but evaluating the trade relationship with any single market can quickly get murky because of these scenarios.
To read original report, click here