
A look at consumer technology products industries
In 2018, the Trump administration initiated an investigation into China’s technology, intellectual property, and innovation practices under Section 301 of the Trade Act of 1974. The investigation found that Chinese acts and policies were burdening U.S. commerce, which prompted the U.S. Trade Representative (USTR) to impose tariffs worth more than $500 billion on imports from China. Our team has been closely tracking the effects of these tariffs, including gathering data on exclusion requests filed by U.S. importers and analyzing what the information can tell us. We received helpful input from The Lincoln Network as well.
There have been four tariff lists, or tranches, in the last four years. The tariffs were imposed on more than 10,000 product categories: 818 in tranche 1, 279 in tranche 2, 5,733 in tranche 3, and 3,207 in tranche 4A. Although tranche 4 was split into 4A and 4B, 4B tariffs were suspended as part of trade negotiations in 2019. The USTR also established the process by which interested parties could request exclusion from tariffs.
As for exclusion requests, since our last Section 301 update, the number filed hasn’t changed. As of September 6, 2021, importers had filed 52,746 product exclusion requests: 10,814 for tranche 1, 2,869 for tranche 2, 30,283 for tranche 3, and 8,780 for tranche 4A. Exclusions are valid for one year, at which point U.S. importers can apply for an extension.
The USTR has been reviewing extension requests and recently announced that it would reinstate Section 301 tariff exclusions for 352 products. To determine which imports would receive an exemption until the end of the year, the USTR reviewed whether products can be sourced from the United States or elsewhere.
In light of the recent USTR announcement and its impact on industries and workers, we are updating our Section 301 data and turning to sector-level analysis. This update focuses on consumer technology products. Consumer technology imports cover a wide range of products, such as clinical thermometers, gaming devices, drinking water coolers, and even tracking devices, representing a fairly large share of the goods targeted by the section 301 tariffs. In 2017 (the year before the tariffs were imposed), the customs value of consumer technology product imports was approximately $198 billion. We used a list of HTS codes derived from public comments filed by the Consumer Technology Association for our analysis.
Our key findings include:
- Consumer technology product importers have been actively filing for exclusion requests. These U.S. importers have filed an exclusion request for 99% of their products that have been subject to the tariff.
- Approval and denial outcomes for consumer technology product exclusion requests mirror overall product trends, with only 13% to 14% approved, and approval rates higher in the first two tranches than the third and fourth tranches.
- Based on the 8-digit HTS codes for those consumer technology product imports on the section 301 list, China’s share of U.S. imports declined from 33.2% in 2017 to 19.4% in 2021. This is a larger change than seen in overall imports, for which China’s share declined from 22% to 18%. This may reflect the relatively large presence of consumer technology products in section 301 lists combined with USTR’s relatively high rate of denials for exclusion requests.
- For the consumer technology products subject to the tariffs, there was some shifting from China to other countries, but not as much as policymakers may have hoped. China’s share of U.S. imports in the affected product areas declined from 35.8% to 27.5% over 2017 to 2021. Meanwhile, those shares increased for several Southeast Asian economies such as Vietnam, Taiwan, Thailand, South Korea, and Malaysia. Mexico’s share remained relatively flat.
- Based on more detailed 10-digit HTS data (the level at which extensions are often granted), we find that approximately 40% of consumer technology product tariff exclusions received an extension.
Exclusions
As previously mentioned, consumer technology product importers have filed exclusion requests for 99% of the products that have been subject to the tariff (table 1), or 21,583 of the 21,896 consumer technology products. Overall, the outcomes for consumer technology product exclusion requests mirror statistics for other products (table 2). Of the 52,746 product exclusion requests, 6,802 (13%) were granted an exclusion and 45,944 (87%) were denied. For consumer technology products, there were 21,583 exclusion submissions, 3,097 (14%) of which were approved and 18,486 (86%) were denied.
Table 1. Consumer technology products subject to Section 301 tariffs: tariff exclusion requests filed and not filed (as of April 7, 2022)
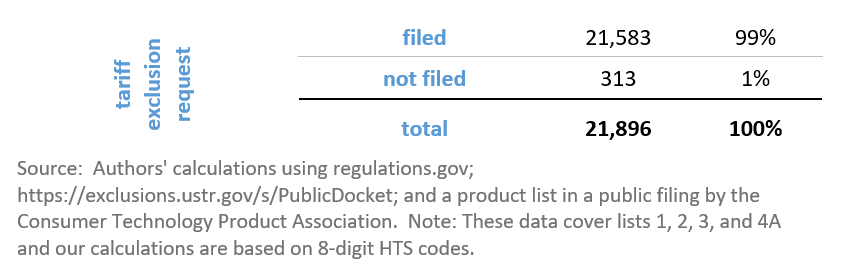
Table 2. Summary tables: Outcomes for tariff exclusion requests
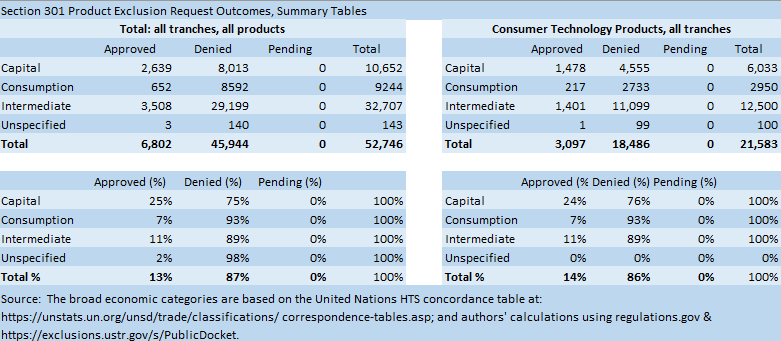
Table 3 reports the outcomes for exclusion requests for all products by tranche, while Table 4 reports the same data for consumer technology products.
Table 3. Outcomes for tariff exclusion requests: all products
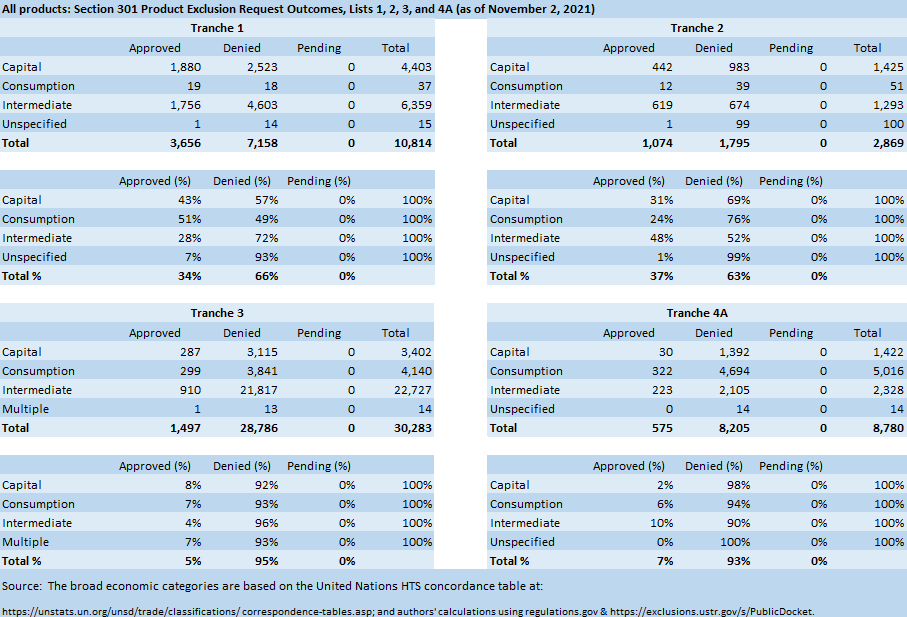
Table 4. Outcomes for tariff exclusion requests: consumer technology products
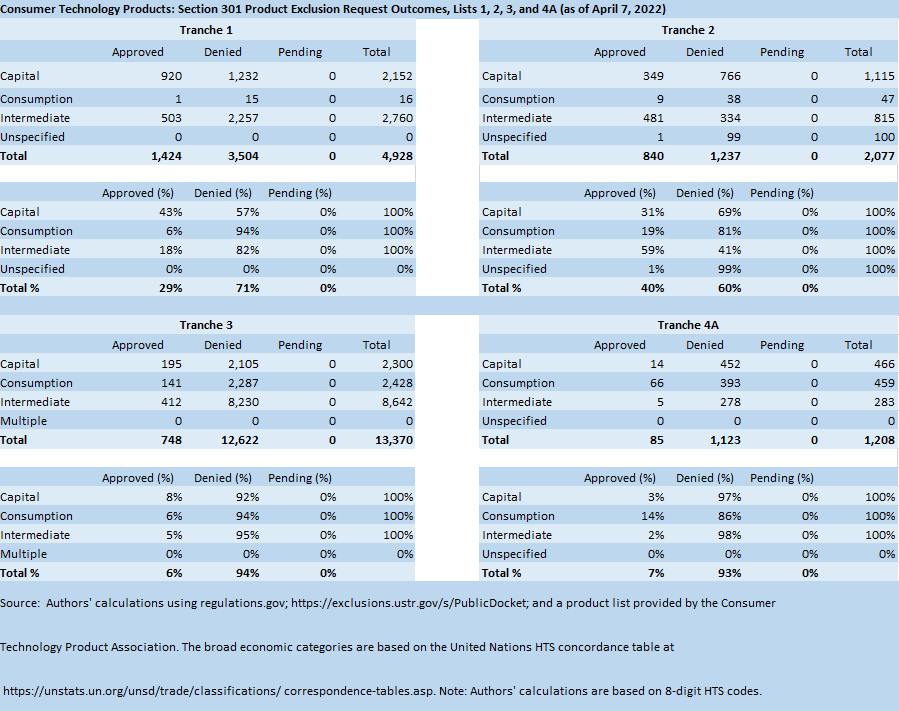
Outcomes vary by tranche. Overall, the approval rating was 34% for tranche 1, 37% for tranche 2, 5% for tranche 3, and 7% for tranche 4A. Overall consumer product outcomes are similar, with the approval ratings of 29% for tranche 1, 40% for tranche 2, 6% for tranche 3, and 7% for tranche 4A.
Extensions
As USTR reviews requests extensions for tariff exclusions, the reasons or categories differ. Table 5 lists the number of consumer technology products granted an extension by decision category, including standard extensions granted, Covid-19 extensions, and reinstatements. A small share (2%-3%) of extensions for these products was Covid-related. The share of those reinstated increases over time. (These statistics are based on 10-digit HTS data and hence the absolute figures will not compare with those of the 8-digit-based statistics. We only did this to show the distribution of types of extensions, which had to be done at the 10-digit level.)
Table 5. Extensions granted for consumer technology products (calculated at the 10-digit level)

Overall, statistics based on 10-digit HTS indicate that 40% of consumer technology product exclusions granted received extension at some point since 2018.
Note that a product could have received an extension multiple times. For example, “Wireless communication apparatus that can receive audio data to be distributed to wireless speakers (described in statistical reporting number 8518.22.0000)” received an extension on both September 2, 2020, and March 28, 2022.
Some shifting of trade partners
Among consumer technology products subject to the tariffs, there was some shifting from China to other countries, but not as much as policymakers may have hoped. In this case, we use HTS 4-digit level codes to capture broader substitutions and product reclassifications. The data indicate that China’s share of U.S. imports declined from 35.8% to 27.5% over 2017 to 2021, or an 8.3 percentage point decrease. Yet China remained by far the largest import source, with Mexico relatively flat and a far second at 17.51% in 2021. Meanwhile, shares increased for Southeast Asian economies such as Vietnam, Taiwan, Thailand, South Korea, and Malaysia (figure 1).
Further analysis should include these calculations at the 4-, 6-, 8- and 10-digit levels in order to assess whether and to what extent product shifting within fairly detailed categories occurred (i.e., if there was a tariff on imported blue widgets with white polka dots from China, was there a consumer shift to blue widgets with red polka dots from China, or perhaps a shift to just plain blue widgets from Vietnam?).
Figure 1. Changes in US import shares in consumer technology product areas affected by setion 301 tariffs, 2017-2021

Conclusion
Exclusion outcomes for consumer technology products differed across tranches. The analysis could be extended to other sectors, especially given the recent changes in USTR reporting. Since the release of a Government Accountability Office (GAO) report, the USTR developed internal procedures that describe the process of determining which products qualify for a tariff exclusion. These changes may help policymakers to get a better understanding of the impact of Section 301 tariffs, though the reasons for USTR decisions on exclusions and extensions remain vague.
The U.S. International Trade Commission recently announced a new factfinding investigation that will examine the impact of the section 301 tariffs and the section 232 tariffs on steel and aluminum imports.
Also, the Office of the U.S. Trade Representative is about to commence a statutory four-year review of the Section 301 actions. That review will consider “the effectiveness [of the tariffs] in achieving the objectives.”
Beyond assessing changes in China’s intellectual property rights regime and technology transfer regime, it is not clear what criterion USTR will use to determine effectiveness. Questions that officials asked at the public hearings, however, often focused on whether there was existing domestic production or potential for domestic production, as well as the possibility of third-country sources. Finally, enough time has passed to allow for an assessment of downstream effects of the tariffs, as well as an assessment of whether and to what extent the tariffs spurred domestic production in the subject product area and/or a diversion to third party sources.
Christine McDaniel is a Senior Research Fellow at the Mercatus Center. Her research focuses on international trade, globalization, and intellectual property rights.
Polina Prokof’yeva is a second-year MA student in the Department of Economics at George Mason University. Polina graduated from Concord University with a BS in geography.
To read the full commentary by the Mercatus Center of George Mason University, please click here.