U.S. August export data were released earlier this month. While there are some improvements in some categories of merchandise exports in August, China remains far behind its overall commitments in the U.S.-China Phase I Trade Agreement. as As reported in prior posts, both China and the U.S. have taken steps to implement parts of the Phase 1 Agreement that took effect on February 14, 2020. The big question mark on the Phase 1 Agreement has been whether the agreement to increase imports from the United States is likely to be met by China. Prior posts on the U.S.-China Phase 1 Agreement can be found here: September 12, 2020, U.S.-China Phase I Trade Agreement – How is China Doing to Meet Purchase Commitments for the First Year; a Review of U.S. Domestic Exports through July 2020, https://currentthoughtsontrade.com/2020/09/12/u-s-china-phase-1-trade-agreement-how-is-chinadoing-to-meet-purchase-commitments-for-the-first-year-a-review-of-u-s-domestic-exports-throughjuly-2020/ ; August 8, 2020, U.S.-China Phase 1 trade agreement – review of U.S. domestic exports through June 2020, https://currentthoughtsontrade.com/2020/08/08/u-s-china-phase-1-tradeagreement-review-of-u-s-domestic-exports-through-june-2020/ ; July 10, 2020, U.S.-China Phase 1 Trade Agreement – limited progress on increased U.S. exports to China (through May), https://currentthoughtsontrade.com/2020/07/10/u-s-china-phase-1-trade-agreement-limited-progresson-increased-u-s-exports-to-china-through-may/ ; June 5, 2020, U.S.-China Phase I Deal is Failing Expanded U.S. Exports Even Before Recent Eworts by China to Limit Certain U.S. Agriculture Exports as Retaliation for U.S. Position on Hong Kong, https://currentthoughtsontrade.com/2020/06/05/u-s-china-phase-i-deal-is-failing-expanded-u-sexports-even-before-recent-eworts-by-china-to-limit-certain-u-s-agriculture-exports-as-retaliation-for-us-position-on-hong-kong/ ; May 12, 2020, U.S.-China Phase I Agreement some progress on structural changes; far behind on trade in goods and services, https://currentthoughtsontrade.com/2020/05/12/u-s-china-phase-i-agreement-some-progress-onstructural-changes-far-behind-on-trade-in-goods-and-services/ ; January 19, 2020, U.S.-China Phase 1 Agreement – Details on the Expanding Trade Chapter, https://currentthoughtsontrade.com/2020/01/19/u-s-china-phase-1-agreement-details-on-theexpanding-trade-chapter/; January 15, 2020, U.S.-China Phase 1 Trade Agreement Signed on January 15 – An Impressive Agreement if Enforced, https://currentthoughtsontrade.com/2020/01/15/u-s-china-phase-1-trade-agreement-signed-onjanuary-15-an-impressive-agreement-if-enforced/.
An unusual aspect of the Phase 1 Agreement is agreement by China to increase imports from the United States of various categories of goods and services during the first two years of the Agreement with 18 categories of goods grouped in three broad categories (manufactured goods, agriculture and energy) and five services categories. Chinese imports of goods and services from the United States under the Agreement are supposed to increase by $76.7 billion in the first year over levels achieved in 2017 and in the second year by $123.3 billion over 2017 levels. The categories and tariff items included in the goods categories are reviewed in Annex 6.1 of the Agreement and the attachment to Annex 6.1. In the confidential version of the agreement, growth levels are provided for each of the 23 categories of goods and services.
While the COVID-19 pandemic has affected trade flows for most countries including both China and the United States and while bilateral relations between the U.S. and China have deteriorated since the signing of the Phase 1 Agreement, the U.S. continues to report that China intends to honor its purchase commitments in this first year. Article 6.2 of the Agreement defines the time period for the purchase commitments as being January 1, 2020 through December 31, 2021. So the first year is calendar year 2020. However, since the Agreement took effect in mid-February, my analysis has focused on the period since the agreement went into effect (for statistics, from March 1, 2020). Including January and February data makes the achieving of first year objectives even more improbable as monthly U.S. domestic exports to China would have to be more than four times (4.07) the monthly average in January-August (compared to 2.41 times the monthly average if looking just at March-August) to meet a first year goal of $184.009 billion (which assumes U.S. exports of products not covered by Annex 6.1 are at 2017 levels).
A six month review of progress on the overall Phase 1 Agreement by the U.S. and China was held by phone on August 24, 2020, with U.S. noting that both parties are committed to ensuring the success of the agreement, including the purchases of U.S. goods.
As reviewed in earlier posts, some goods categories have data issues on the U.S. side (aircraft (orders and deliveries) show $0 exports for the entire period between 2017 and July 2020). Moreover, Amb. Lighthizer has testified to Congress that China has made some large agricultural purchases for shipments later in the year that don’t show up in the U.S. export data at the present time, although there are some increases in soybeans reported in August. Similarly, U.S. export data on services are available quarterly for some of the relevant categories and annually for certain information. However, services trade data with China for 2020 are not yet available. Total U.S. exports of services in the first half of 2020 to all countries was down 14.83%. Travel services were down more sharply, 46.32%. While the Phase 1 Agreement has large increases in U.S. services exports in the first year of the agreement ($12.8 billion over 2017 levels), the data doesn’t presently exist to measure progress on services under the Phase 1 Agreement, though it is believed that China is far behind on its commitments to increase U.S. exports of services.
Looking just at U.S. domestic export data for goods to China for the period March – August 2020, China is far behind meeting the ambitious purchase commitments made with the United States for the first year of the Agreement. It is even further behind if the January-August period is considered.
Looking at total U.S. domestic exports to China for the period March-August 2020, U.S. exports were $48.534 billion ($8.089 billion/month) compared to $55.019 billion in 2017 ($9.170 billion/month). These include both products covered by the Annex 6.1 commitments and other products. For the JanuaryAugust 2020 period total U.S. exports were $61.051 billion ($7.631 billion/month) compared to $73.379 billion in 2017 ($9.172 billion/month).
Total 2017 U.S. domestic exports of goods to China were $120.1 billion. The Phase 1 Agreement calls for increases on a subset of goods of $63.9 billion in the first year. Thus, the target for the first year of the U.S.-China Phase 1 Agreement is U.S. exports to China of $184 billion if non-subject goods are exported at 2017 levels.
Other U.S. domestic exports not covered by the 18 categories in Annex 6.1 were $49.026 billion in 2017 (full year). For the period March – August, 2020 figures for the 18 categories have increased 8.92% from comparable levels in 2017 (with a large increase in August, as March-July had shown 4.19%). Noncovered products (which face significant tariws in China based on retaliation for US 301 duties) have declined 37.85%, and total exports to China are down 11.79%. Looking at January – August, figures for the 18 categories declined 2.09% while other U.S. domestic exports were down 36.98% from comparable levels in 2017.
Thus, the first six months since the U.S.-China Phase 1 Agreement went into effect suggest that U.S. domestic exports of the Annex 6 goods will be $78.663 billion if the full year shows the same level of increase over 2017 for each of the 18 categories of goods; non-covered products would be $30.469 billion, for total U.S. domestic exports to China of $109.132 billion. This figure would be far below 2017, slightly below 2018 and 15.98% above 2019. It is obviously dramatically below the target of $184.0 billion. The same is true if one looks at January-August 2020 which suggest full year 2020 exports of Annex 6 goods of $68.527 billion, other exports of $30.896 billion, for total domestic exports in 2020 of $99.423 billion even further behind 2017 and 2018 and a smaller increase from the depressed 2019 data.
Even accepting the steep decline in non-covered goods using March-August as the relevant data, the first year should result in total U.S. domestic exports of $165.452 billion if the increase in covered goods is achieved — an amount 51.61% greater than current trends for total U.S. exports. To achieve that level of U.S. exports in the September 2020-February 2021 period, U.S. domestic exports of the 18 categories of goods in Annex 6.1 would have to be $101.589 billion ($16.931 billion/month) an amount that is 3.04 times the monthly rate of exports of the 18 categories to China in the March-August 2020 period ($5.566 billion/month).
If one uses January-August for comparison and for other US exports, 2020 should $165.879 billion as the commitment level which is higher than estimated 2020 figures based on the first eight months of 66.84%. With only four months data remaining in 2020, U.S. exports of goods covered by Annex 6.1 would have to be $93.430 billion or $23.357 billion/month which is 4.50 times the average of $5.194 billion of the January-August period.
Chinese data on total imports from all countries (in U.S. dollars) for January-August show a decline of 5.2% from the first eight months of 2019. http://english.customs.gov.cn/statics/report/monthly.html . General Administrator of Customs of the People’s Republic of China, China’s Total Export & Import Values, August 2020 (in USD). China’s imports from the U.S. were down 2.9% during the same time period, but show imports from the U.S. substantially larger than U.S. domestic exports ($78.241 billion vs. $61.051 billion, though Chinese imports would be CIF value vs. FAS value for U.S. exports and may include U.S. exports to third countries or territories that end up in China).
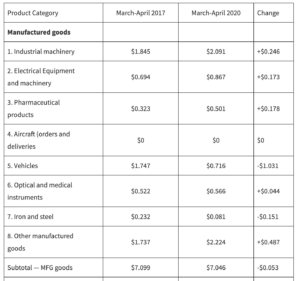
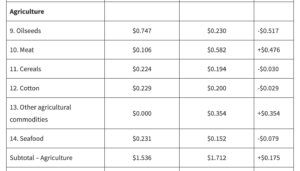
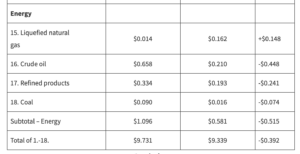
The 18 product categories included in Annex 6.1 of the Phase 1 Agreement show the following for MarchAugust 2017, March-August 2020 and rate of growth for the first year of the Agreement versus full year 2017 (figures in $ million):
- If one used January-August, manufactured goods were down 2.89% from 2017 levels and require $48.138 billion to be exported in the remaining four months of 2020 to reach the first year commitments ($12.035 billion/month). For agricultural goods, U.S. exports were down 6.86% from 2017 levels and require $23.744 billion to be exported in the remaining four months of 2020 to reach the first year commitments ($5.936 billion/month). On energy, U.S. exports were up 16.32% over 2017 levels and require exports of $21.547 billion in the remaining four months to reach first year commitments ($5.387 billion/month). For all Annex 6.1 goods, U.S. exports in the January-August period were down 2.09% with additional exports to meet first year commitments equal to $93.430 billion ($23.357 billion/month).HS 8802 for aircraft shows no U.S. domestic exports to China for any month in the 2017-August 2020 period based on U.S. Census data as compiled by the U.S. International Trade Commission’s data web. U.S. export data don’t show orders just shipments.
- The Phase 1 increase for manufactured goods and for all goods is overstated to the extent that the dollar value of increased purchases include aircraft, since U.S. domestic export data are not showing any shipments to China.
China has recovered more quickly from COVID-19 economic challenges than has the U.S. However, as reviewed above, their total imports from all countries (and from the United States) are down in the first eight months of 2020. Thus, whether China will or can expand imports from the U.S. to the extent envisioned by the U.S.-China Phase 1 Agreement in the first year of its implementation is yet to be seen, but seems highly unlikely despite the position taken by the U.S. and by improved purchases of some U.S. goods in August.
Conclusion
As reviewed in prior posts, the U.S.-China Phase 1 Agreement is a potentially important agreement which attempts to address a range of U.S. concerns with the bilateral relationship and obtain somewhat better reciprocity with the world’s largest exporter. The Phase 1 Agreement has lex other challenges to a Phase 2 negotiation which has not yet begun and will not begin before 2021 at the earliest.
While there has been some progress on non-trade volume issues that are included in the Phase 1 Agreement as reviewed by USTR following the six month review call between the parties, there has been very little forward movement in expanding U.S. exports to China in fact. Indeed with the sharp contraction of U.S. exports of products not included in Annex 6.1 of the Phase 1 Agreement, the current trend lines will have U.S. total exports of goods to China coming in lower than was true in either 2017 or 2018 and only somewhat higher than the very depressed 2019 figures. More importantly, the trend line of U.S. domestic exports would result in China missing its first year target for purchases of U.S. goods by $56.32 – 74.88 billion (if use March-August) or by $66.46-84.58 (if use January-August). By back loading purchases of various U.S. agricultural products, China has projected to the U.S. greater efforts to meet purchase targets, and yet has done relatively little to effectuate expanded imports from the U.S. ahead of Presidential elections, now just a little more than three weeks away.
With the process of selecting a new Director-General for the World Trade Organization now down to selecting between the two candidates who have advanced to the final round of consultations, it is unclear when and if the WTO will be able to engage in meaningful reform efforts such that the large bilateral concerns between the U.S. and China can be brought back under the WTO or whether the world is in for many years of bilateral tensions with actions outside of the system the norm and not the exception.
Terence Stewart, former Managing Partner, Law Offices of Stewart and Stewart, and author of the blog, Current Thoughts on Trade.
To read the original blog post, click here.