As reported in prior posts, both China and the U.S. have taken steps to implement parts of the Phase 1 Agreement that took effect on February 14, 2020. See July 10, 2020, U.S.-China Phase 1 Trade Agreement – limited progress on increased U.S. exports to China (through May), https://currentthoughtsontrade.com/2020/07/10/u-s-china-phase-1-trade-agreement-limited-progress-on-increased-u-s-exports-to-china-through-may/;
June 5, 2020, U.S.-China Phase I Deal is Failing Expanded U.S. Exports Even Before Recent Efforts by China to Limit Certain U.S. Agriculture Exports as Retaliation for U.S. Position on Hong Kong, https://currentthoughtsontrade.com/2020/06/05/u-s-china-phase-i-deal-is-failing-expanded-u-s-exports-even-before-recent-efforts-by-china-to-limit-certain-u-s-agriculture-exports-as-retaliation-for-u-s-position-on-hong-kong/;
May 12, 2020, U.S.-China Phase I Agreement – some progress on structural changes; far behind on trade in goods and services, https://currentthoughtsontrade.com/2020/05/12/u-s-china-phase-i-agreement-some-progress-on-structural-changes-far-behind-on-trade-in-goods-and-services/;
January 19, 2020, U.S.-China Phase 1 Agreement – Details on the Expanding Trade Chapter, https://currentthoughtsontrade.com/2020/01/19/u-s-china-phase-1-agreement-details-on-the-expanding-trade-chapter/;
January 15, 2020, U.S.-China Phase 1 Trade Agreement Signed on January 15 – An Impressive Agreement if Enforced, https://currentthoughtsontrade.com/2020/01/15/u-s-china-phase-1-trade-agreement-signed-on-january-15-an-impressive-agreement-if-enforced/.
An unusual aspect of the Phase 1 Agreement is agreement by China to increase imports from the United States of various categories of goods and services during the first two years of the Agreement with 18 categories of goods grouped in three broad categories (manufactured goods, agriculture and energy) and five services categories. Chinese imports of goods and services from the United States under the Agreement are supposed to increase by $76.7 billion in the first year over levels achieved in 2017 and in the second year by $123.3 billion over 2017 levels. The categories and tariff items included in the goods categories are reviewed in Annex 6.1 of the Agreement and the attachment to Annex 6.1. In the confidential version of the agreement, growth levels are provided for each of the 23 categories of goods and services.
While the COVID-19 pandemic has affected trade flows for most countries including both China and the United States and while bilateral relations between the U.S. and China have deteriorated since the signing of the Phase 1 Agreement, the U.S. continues to report that China intends to honor its purchase commitments in this first year (February 14, 2020-February 13, 2021).
As reviewed in earlier posts, some goods categories have data issues on the U.S. side (aircraft (orders and deliveries) show $0 exports for the entire period between 2017 and June 2020). Moreover, Amb. Lighthizer has testified to Congress that China is making some large agricultural purchases for shipments later in the year that don’t show up in the U.S. export data at the present time. Similarly, U.S. export data on services are available quarterly for some of the relevant categories and annually for certain information. However, services trade data with China for 2020 are not yet available. Total U.S. exports of services in the first half of 2020 to all countries was down 14.83%. Travel services were down more sharply, 46.32%. While the Phase 1 Agreement has large increases in U.S. services exports in the first year of the agreement ($12.8 billion over 2017 levels), the data doesn’t presently exist to measure progress on services under the Phase 1 Agreement, though it is believed that China is far behind on its commitments to increase U.S. exports of services.
Looking just at U.S. domestic export data for goods to China for the period March – June 2020, China is far behind meeting the ambitious purchase commitments made with the United States for the first year of the Agreement.
Looking at total U.S. domestic exports to China for the period March-June 2020, U.S. exports were $31.0 billion ($7.761 billion/month) compared to $35.922 billion in 2017 ($.8.98 billion/month). In fact, 2018 shows the highest March-June exports to China ($40.998 billion ($10.249 billion/month). The March-June 2020 figures are below even 2019 which were $32.425 billion ($8.106 billion/month).
Total 2017 U.S. domestic exports of goods to China were $120.1 billion. The Phase 1 Agreement calls for increases on a subset of goods of $63.9 billion in the first year. Thus, the target for the first year of the U.S.-China Phase 1 Agreement is U.S. exports to China of $184 billion if non-subject goods are exported at 2017 levels.
Other U.S. domestic exports not covered by the 18 categories in Annex 6.1 were $49.026 billion in 2017 (full year). For the period March – June, 2020 figures for the 18 categories have increased 0.98% from comparable levels in 2017. Non-covered products (which face significant tariffs in China based on retaliation for US 301 duties) have declined 33.30%, and total exports to China are down 13.58%.
Thus, the first four months of the 1st year of the U.S.-China Phase 1 Agreement suggest that U.S. domestic exports will be $72.934 billion if the full year shows the same 0.98% increase over 2017; non-covered products would be $32.701 billion, for total U.S. domestic exports to China of $105.635 billion. This figure would be far below 2017, below 2018 and just 12.26% above 2019. It is obviously dramatically below the target of $184.0 billion.
Even accepting the steep decline in non-covered goods, the first year should result in total U.S. domestic exports of $167.683 billion if the increase in covered goods is achieved — an amount 58.7% greater than current trends for total U.S. exports. To achieve that level of U.S. exports in the July 2020-February 2021 period, U.S. domestic exports of the 18 categories of goods in Annex 6.1 would have to be $114.114 billion ($14.264 billion/month) an amount more than twice the monthly rate of exports of the 18 categories to China in the March – June 2020 period.
Chinese data on total imports from all countries (in U.S. dollars) for January-June show a decline of 6.4% from the first six months of 2019. http://english.customs.gov.cn/statics/report/monthly.html. General Administrator of Customs of the People’s Republic of China, China’s Total Export & Import Values, June 2020 (in USD). China’s imports from the U.S. were down 4.8% during the same time period. Total U.S. domestic exports to China are down slightly more for the first six months vs. 2019, -4.99%.
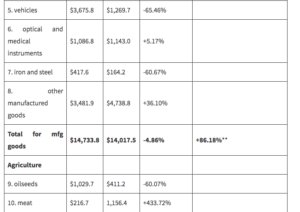
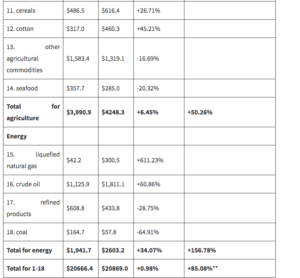
The 18 product categories included in Annex 6.1 of the Phase 1 Agreement show the following for March-June 2017, March-June 20 and rate of growth for the first year of the Agreement versus full year 2017 (figures in $ million):
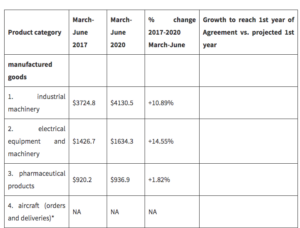
- HS 8802 for aircraft shows no U.S. domestic exports to China for any month in the 2017-June 2020 period based on U.S. Census data as compiled by the U.S. International Trade Commission’s data web. U.S. export data don’t show orders just shipments.
- The Phase 1 increase for manufactured goods and for all goods is overstated to the extent that the dollar value of increased purchases include aircraft, since U.S. domestic export data are not showing any shipments to China.
China has recovered more quickly from COVID-19 economic challenges than has the U.S. However, as reviewed above, their total imports from all countries (and from the United States) are down in the first six months of 2020. Thus, whether China will or can expand imports from the U.S. to the extent envisioned by the U.S.-China Phase 1 Agreement in the first year of its implementation is yet to be seen.
Conclusion
The U.S.-China Phase 1 Agreement is a potentially important agreement which attempts to address a range of U.S. concerns with the bilateral relationship and obtain somewhat better reciprocity with the world’s largest exporter. The Phase 1 Agreement has left other challenges to a Phase 2 negotiation which has not yet begun and almost certainly will not begin before 2021.
While there has been some progress on non-trade volume issues that are included in the Phase 1 Agreement, there has been very little forward movement in expanding U.S. exports to China. Indeed with the sharp contraction of U.S. exports of products not included in Annex 6.1 of the Phase 1 Agreement, the current trend lines will have U.S. total exports of goods to China coming in lower than was true in either 2017 or 2018 and only somewhat higher than the depressed 2019 figures. More importantly, the trend line of U.S. domestic exports would result in China missing its first year target for purchases of U.S. goods by $62 – 78.4 billion.
The bilateral relationship is under increasing strains reflecting both reactions to China’s actions vis-a-vis Hong Kong, the disagreements on the COVID-19 pandemic, ongoing concerns in the United States about possible cyber espionage by Chinese entities which has resulted in the closure of a Chinese consulate in the U.S. and a retaliatory closure of one of the U.S. consulates in China, among other current flash points.
In such circumstances, it is hard to know whether China will fully implement the bilateral agreement or be willing to move forward on a Phase 2 negotiation. While the January – June data support a possible lack of interest by China in fulfilling the purchase agreement provisions, China has released its July data which show a significant increase in imports from the U.S. to $11.276 billion in July which is at least an improvement over the monthly figures for March-June ($7.761 billion/month). On the prospect for interest by China in addressing a Phase 2 negotiation, U.S. intelligence has indicated that China is hoping for a regime change in the U.S. through the November elections, a reading, if correct, which supports a likely wait-and-see approach on any renewed interest in negotiations.
Similarly, it is hard to know if the U.S. will view the agreement as being implemented by China sufficiently to move to the next stage. As the U.S. Administration is in full campaign mode, it is likely the U.S. Administration perceives more electoral value in identifying practices of concern by China than pursuing forward movement on any Phase 2 negotiations. The long distance that exists between current export levels and Agreement targets could well lead the U.S. to view the agreement on the subject of expanded exports to China as not being met and to pursue tariff action under the Agreement. September or October would be the likely months if there are not significant increases in trade volume. As noted, China reports significantly increased imports from the U.S. in July and USTR Lighthizer has indicated that there are large purchases of agricultural goods for late year delivery that are not reflected in U.S. export data. Thus, facts on the ground may lead to focusing Administration concerns with China on issues not involving the Phase 1 Agreement.
What is clear is that trade frictions between the world’s two largest economies are serious, reflect fundamental differences in economic systems, and are complicated by a myriad of other differences between the two nations.
To read the original blog post, click here